.jpg)
Appium Inspector is a tool that can be installed inside the Appium server desktop tool. In this post, we're going to go into detail about what Appium Inspector is and how it works. We'll also show you how to install Appium Inspector on a Windows machine and connect it to an existing application, as well as talk about the different tasks on the connected application.
To make the most of the information, you'll need to have the Appium server GUI installed on your system. You can find out how to do so in our post "Automated Testing With Appium and Python: A How-To Guide."
What Is Appium Inspector?
Appium Inspector is a tool that helps testers find different kinds of selectors. Knowing the different kinds of selectors is a must for automation testing. Appium Inspector helps you find the unique IDs of selectors. Most of the time, testers get APK or IPA files for testing a mobile app, and they need to get the different selectors and hierarchies for testing purposes. Appium Inspector makes this task very easy.
Besides this, Appium Inspector can also be used to record the interactions and automatically generate test cases. We are going to look into this later in the post.
How Does Appium Inspector Work?
At its core, Appium Inspector is an element inspector tool. It is similar to UiAutomatorViewer for Android Studio, and it works with the same logic to provide us with the ID, class name, accessibility ID, and XPath.
How Do I Install Appium Desktop Inspector on Windows?
We need to have the Appium server desktop installed on our system before we can install Appium Inspector.
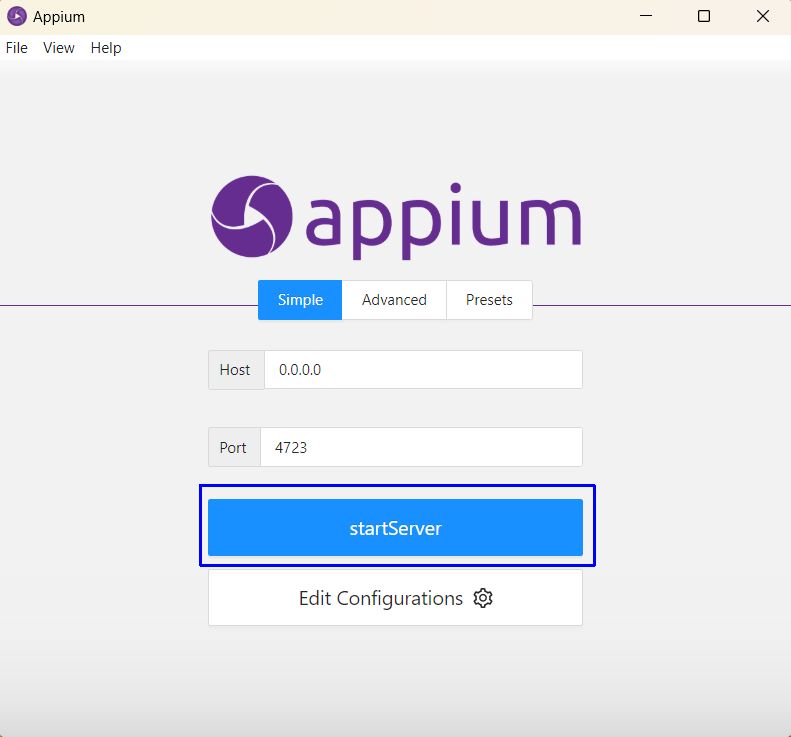
Once the Appium desktop application is installed, open it and click on the startServer button:
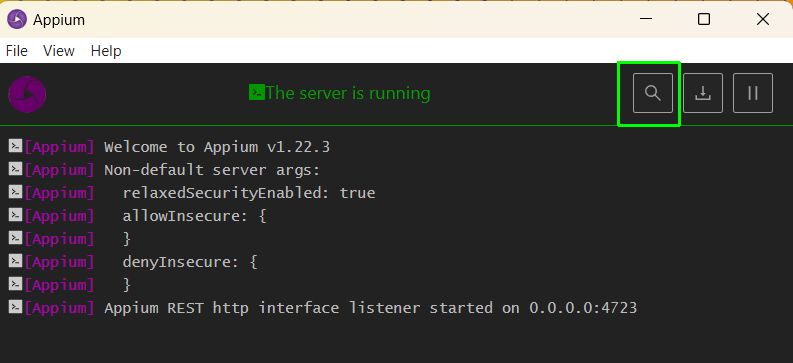
The Appium server will start running on your local machine. Now click on the search icon on the top right of the app:
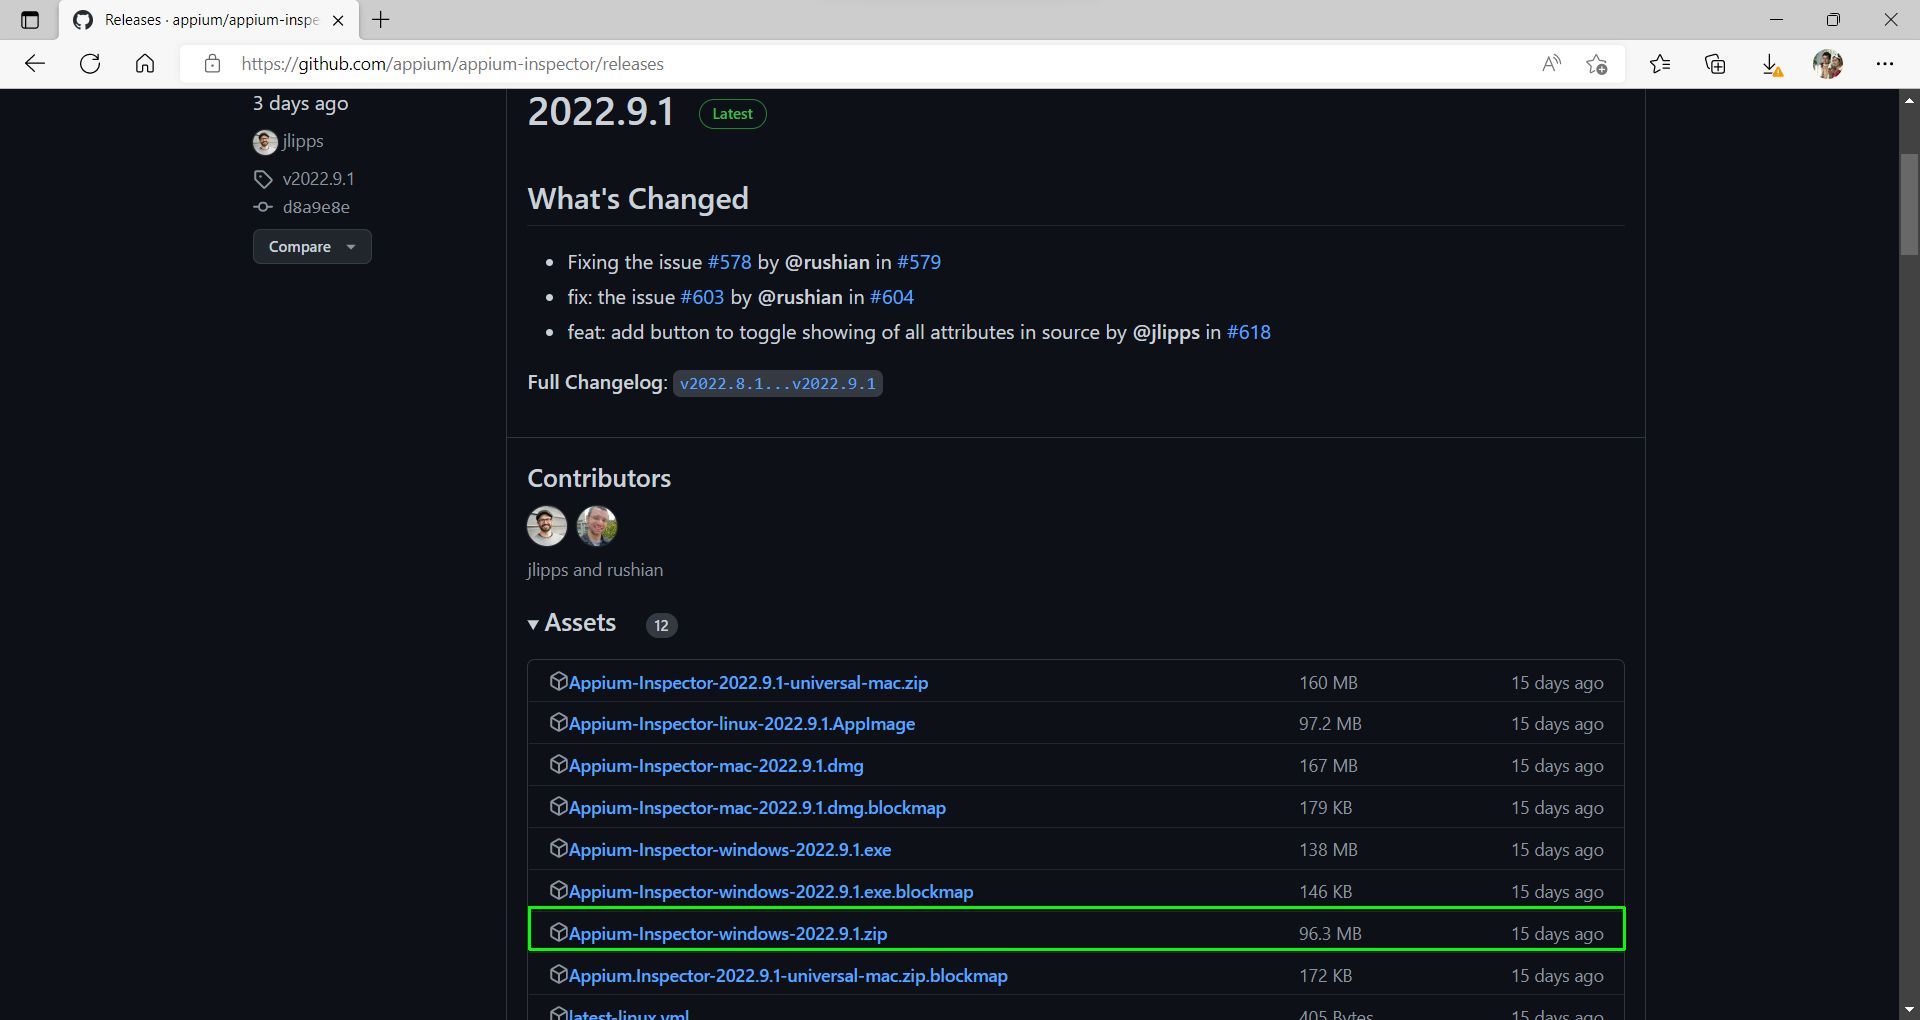
If Appium Inspector is not installed on the machine, which is the case for us, a GitHub link for Appium Inspector will open. We need to scroll down a bit and click on the Releases link:

We will be taken to the latest release page. Here we need to install the application as per our operating system. Since we are using Windows, we need to download that zip file:
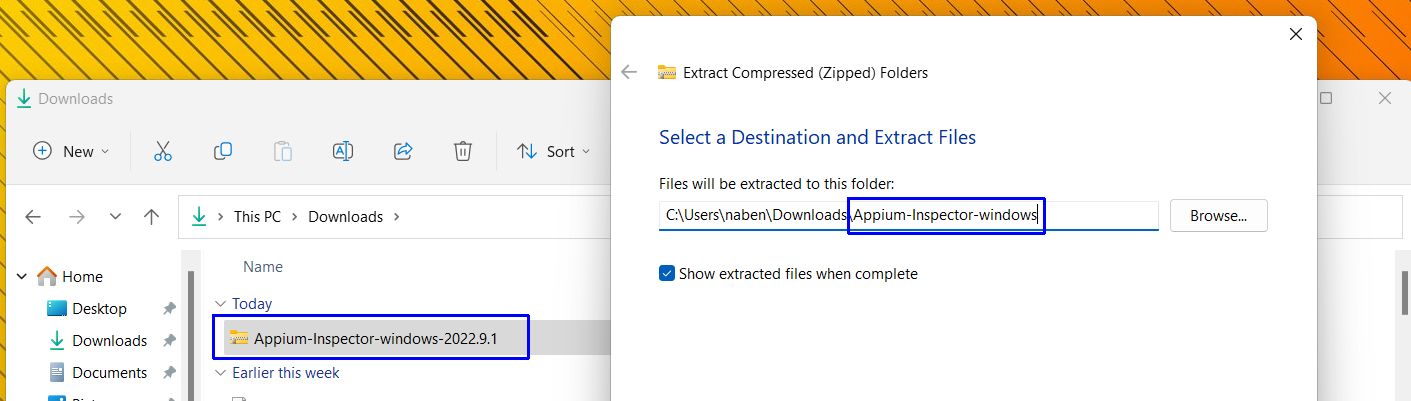
Extract the download in a folder because it contains a lot of files:
How Do I Launch Appium Inspector?
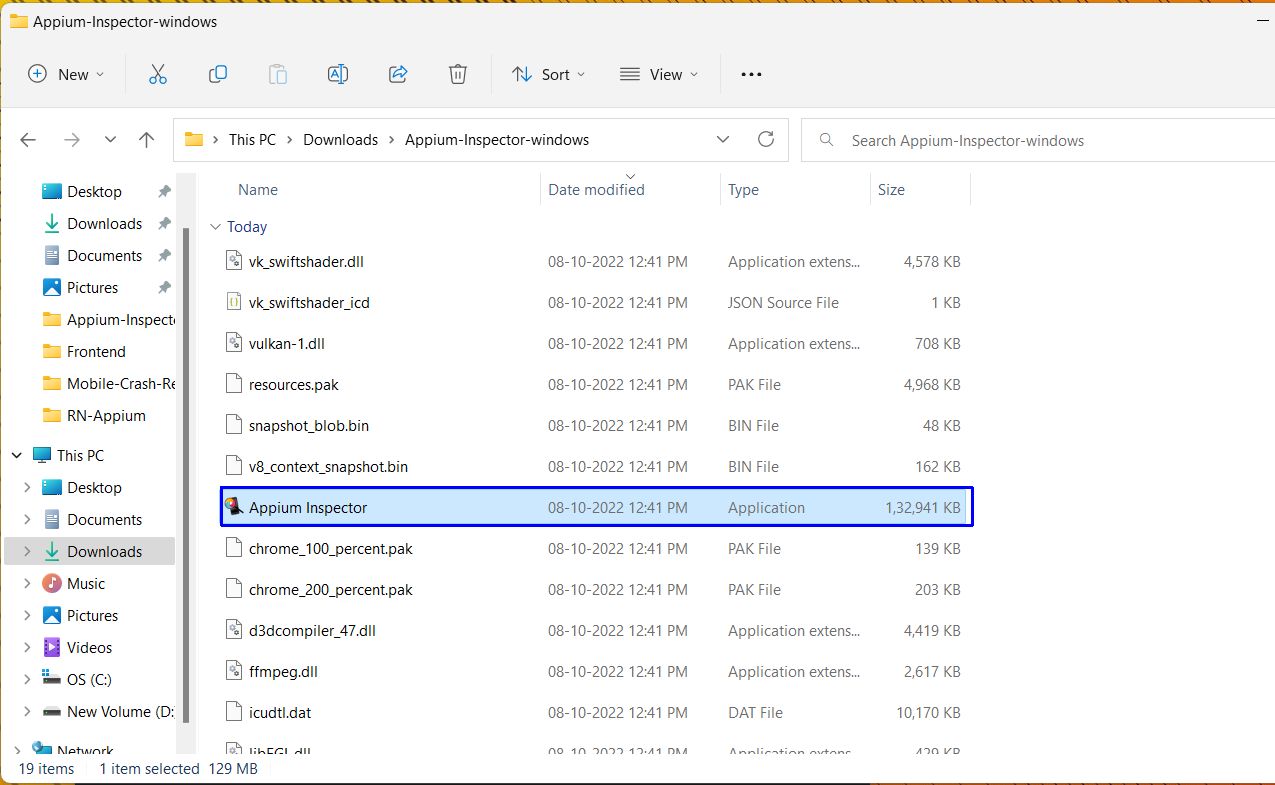
To launch Appium Inspector, we need to go to the extracted folder, which is Appium-Inspector-windows in our case. Here we will find an application with the name "Appium Inspector." Double-click on it to launch Appium Inspector:
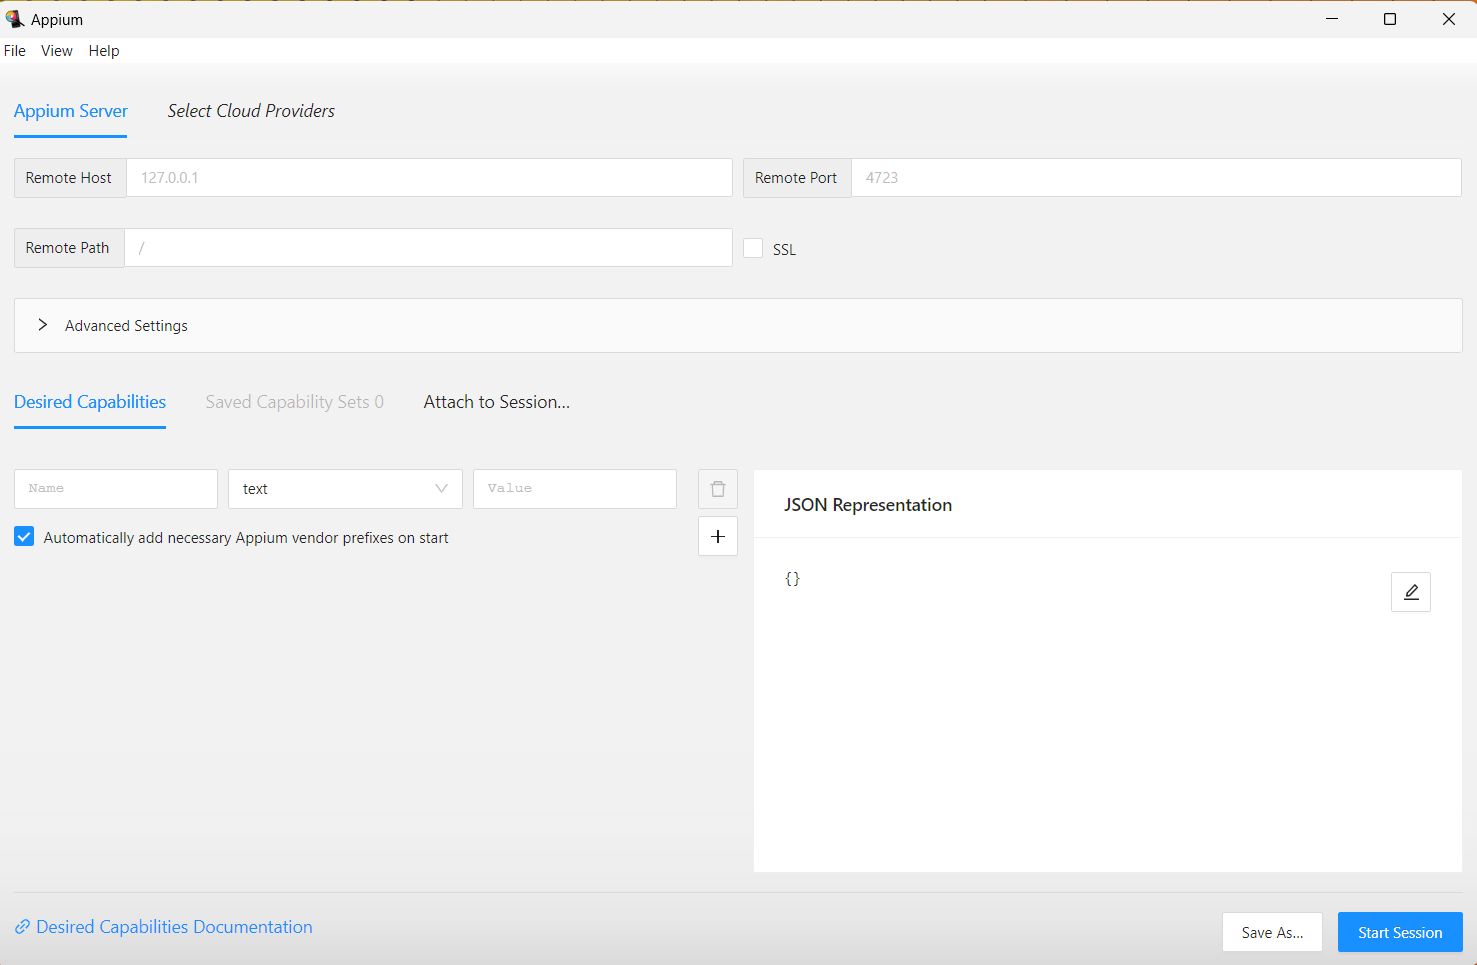
When Appium Inspector is launched, it will show the following:
Saving Desired Capabilities in Appium Inspector
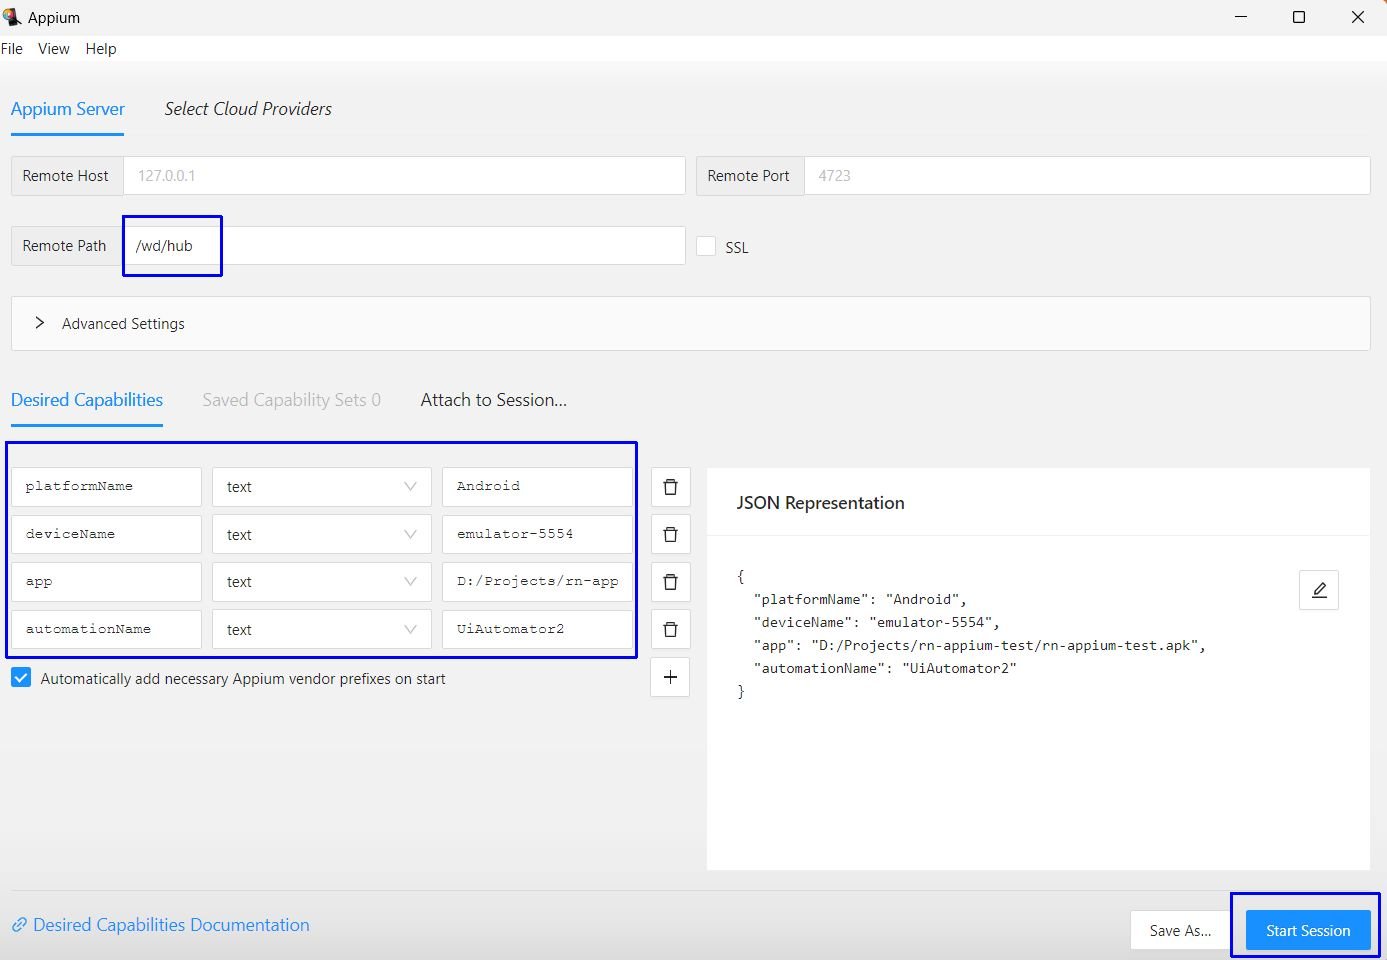
Desired capabilities are required to connect Appium Inspector with the Appium server, as well as inspect the elements. After entering the desired capabilities, click on the Save As... button.

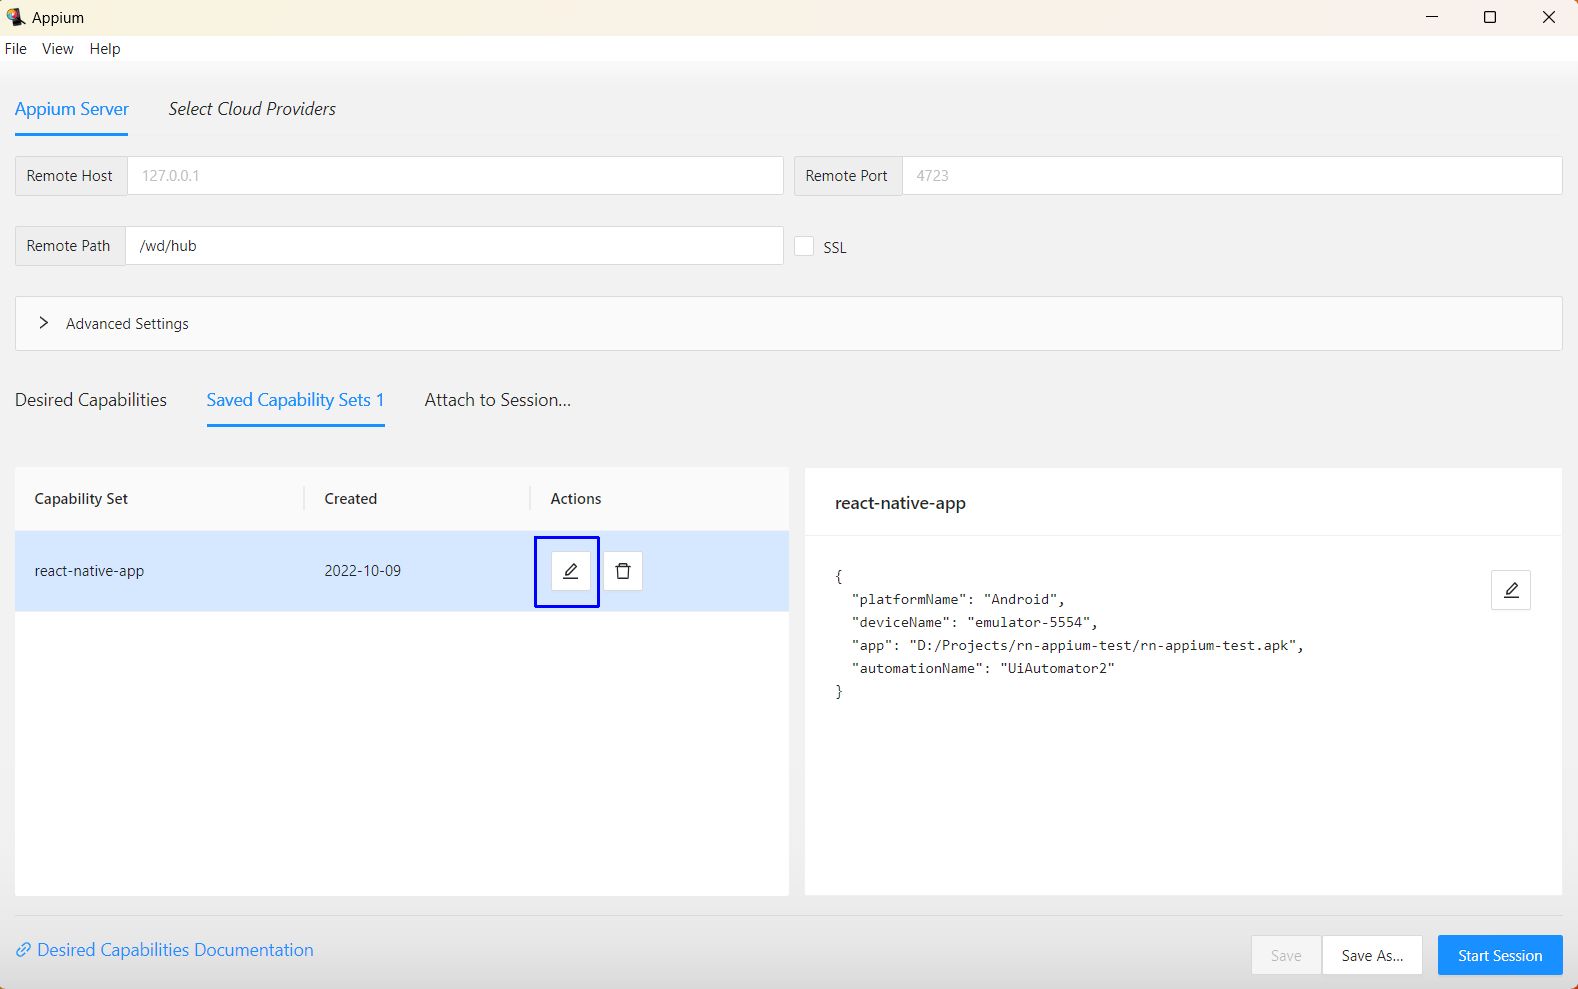
This will open a pop-up where we can enter any familiar name for the capabilities. We are giving it the name "react-native-app." After that, click on the Save button:

The Saved Capability Sets 1 tab will store the capabilities list. Click on the icon to edit the set, and it will be loaded:
Inspecting a React Native App Through Appium Inspector
In our post about testing React Native apps with Appium, we created a React Native application and also generated an APK file. We also started the application on an Android emulator.
Now we also need to give the remote path as "/wd/hub" to connect Appium Inspector to the running app. Then click on Start Session:
This will open the app, along with the application XML after some time. Our simple app is still not completely loaded and is showing that it is getting installed on Appium Inspector.
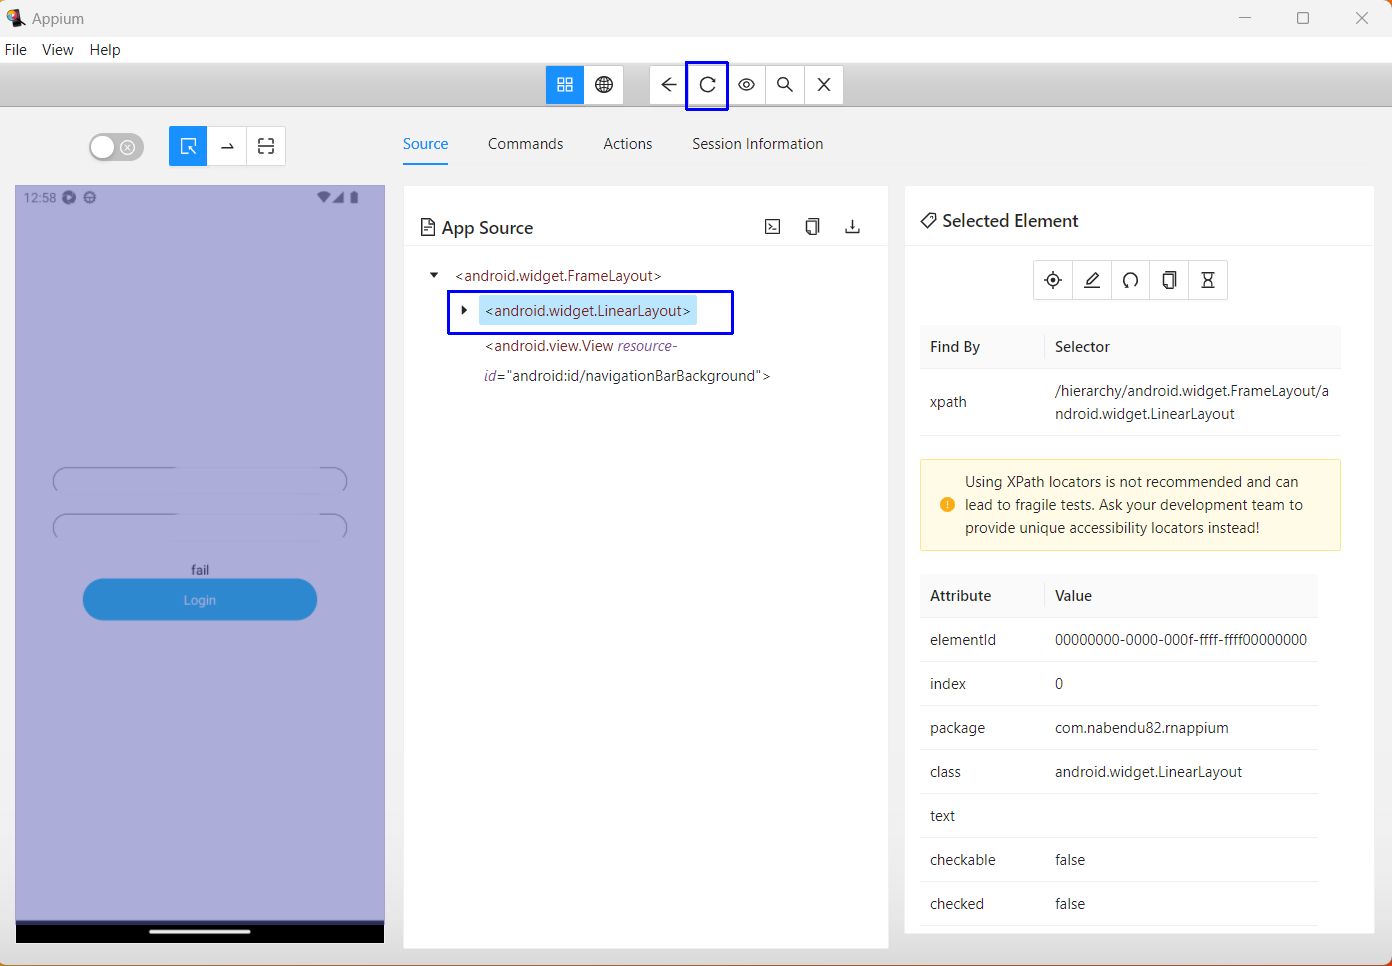
By clicking on one of the elements, we get all of its details in the right pane.

Once our app is completely loaded, it will be shown in the left pane. Selecting a new element will also provide us with its details:
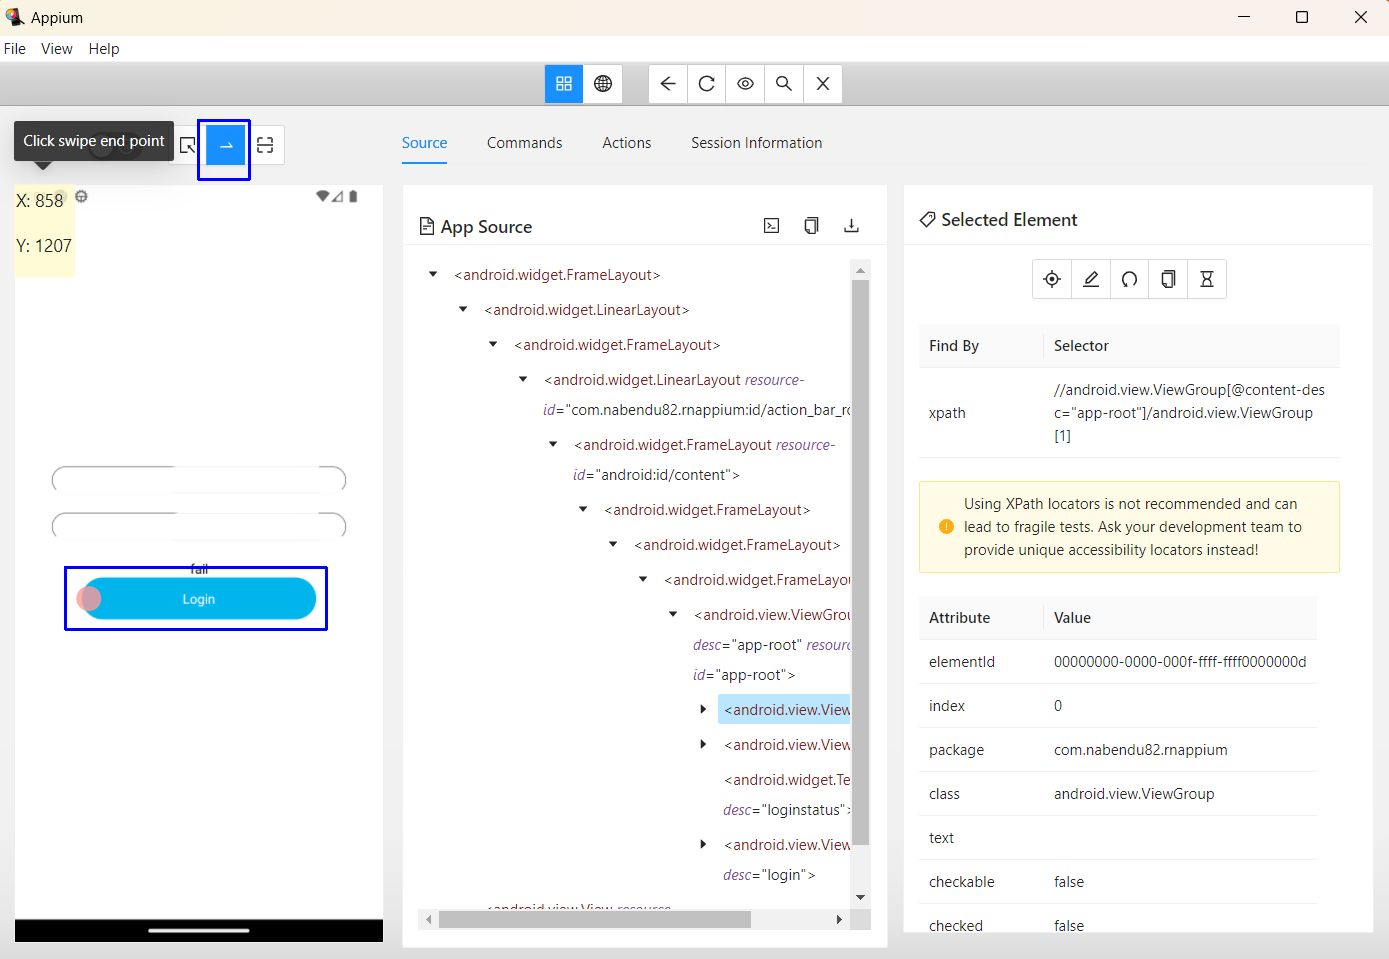
We can also use the swipe gesture in our app. Here we need to click on the arrow button, as shown in the screenshot. After that, we will give the swipe start point at the beginning of the button and the swipe endpoint at the end of the button.
This will perform our swipe function. You can use it better in image-gallery-type apps, which have left and right swipes.
Recording Through Appium Inspector
Appium Inspector also has a very popular option to record the session. This option is particularly useful for generating test cases, which we will look at now.
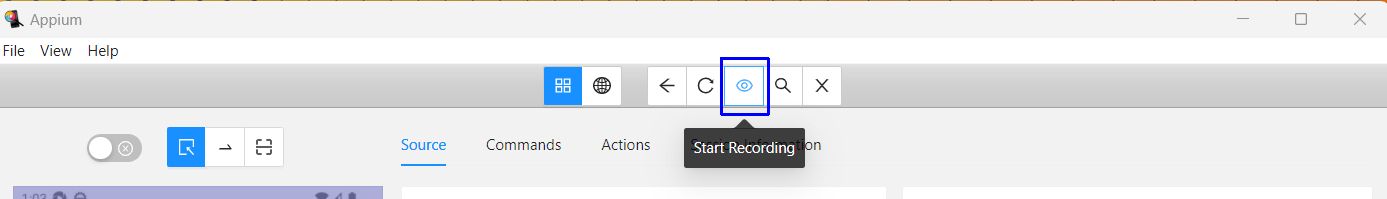
First, click on the eye icon, which represents the recording capability. It will now start the recording.
We did a small test by swiping the Login button and then clicking on the Pause Recording button. This button starts showing while recording.
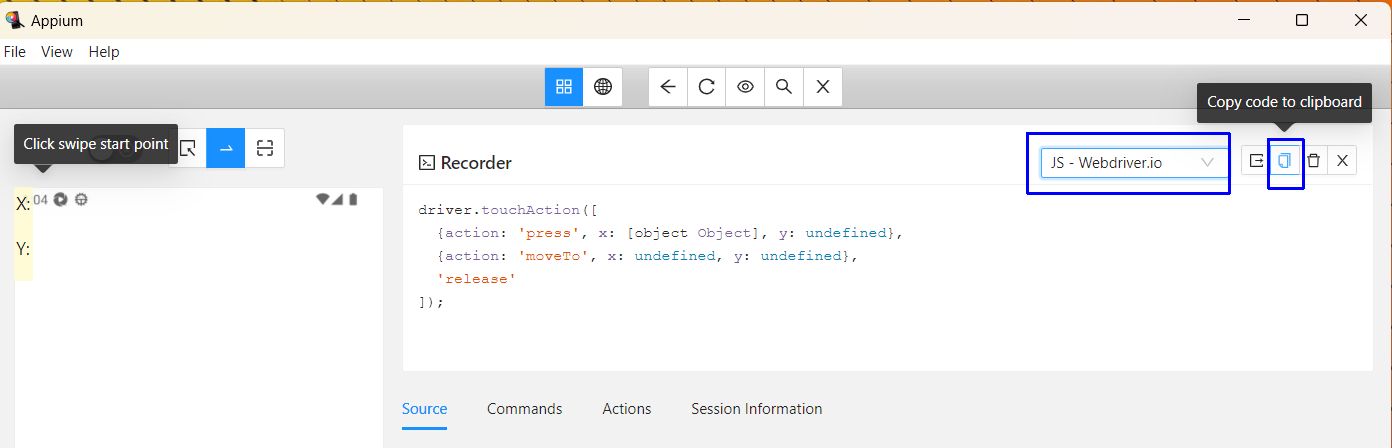
Now, in the new Recorder section, we will see our auto-generated test. Also, notice that the type of test is "Java - JUnit."

We can also change the test, and there are a lot of different options for it. Here we have changed it to "JS - Webdriver.io." We can also click on the Copy code to clipboard icon:
Reverse Search Through Appium Inspector
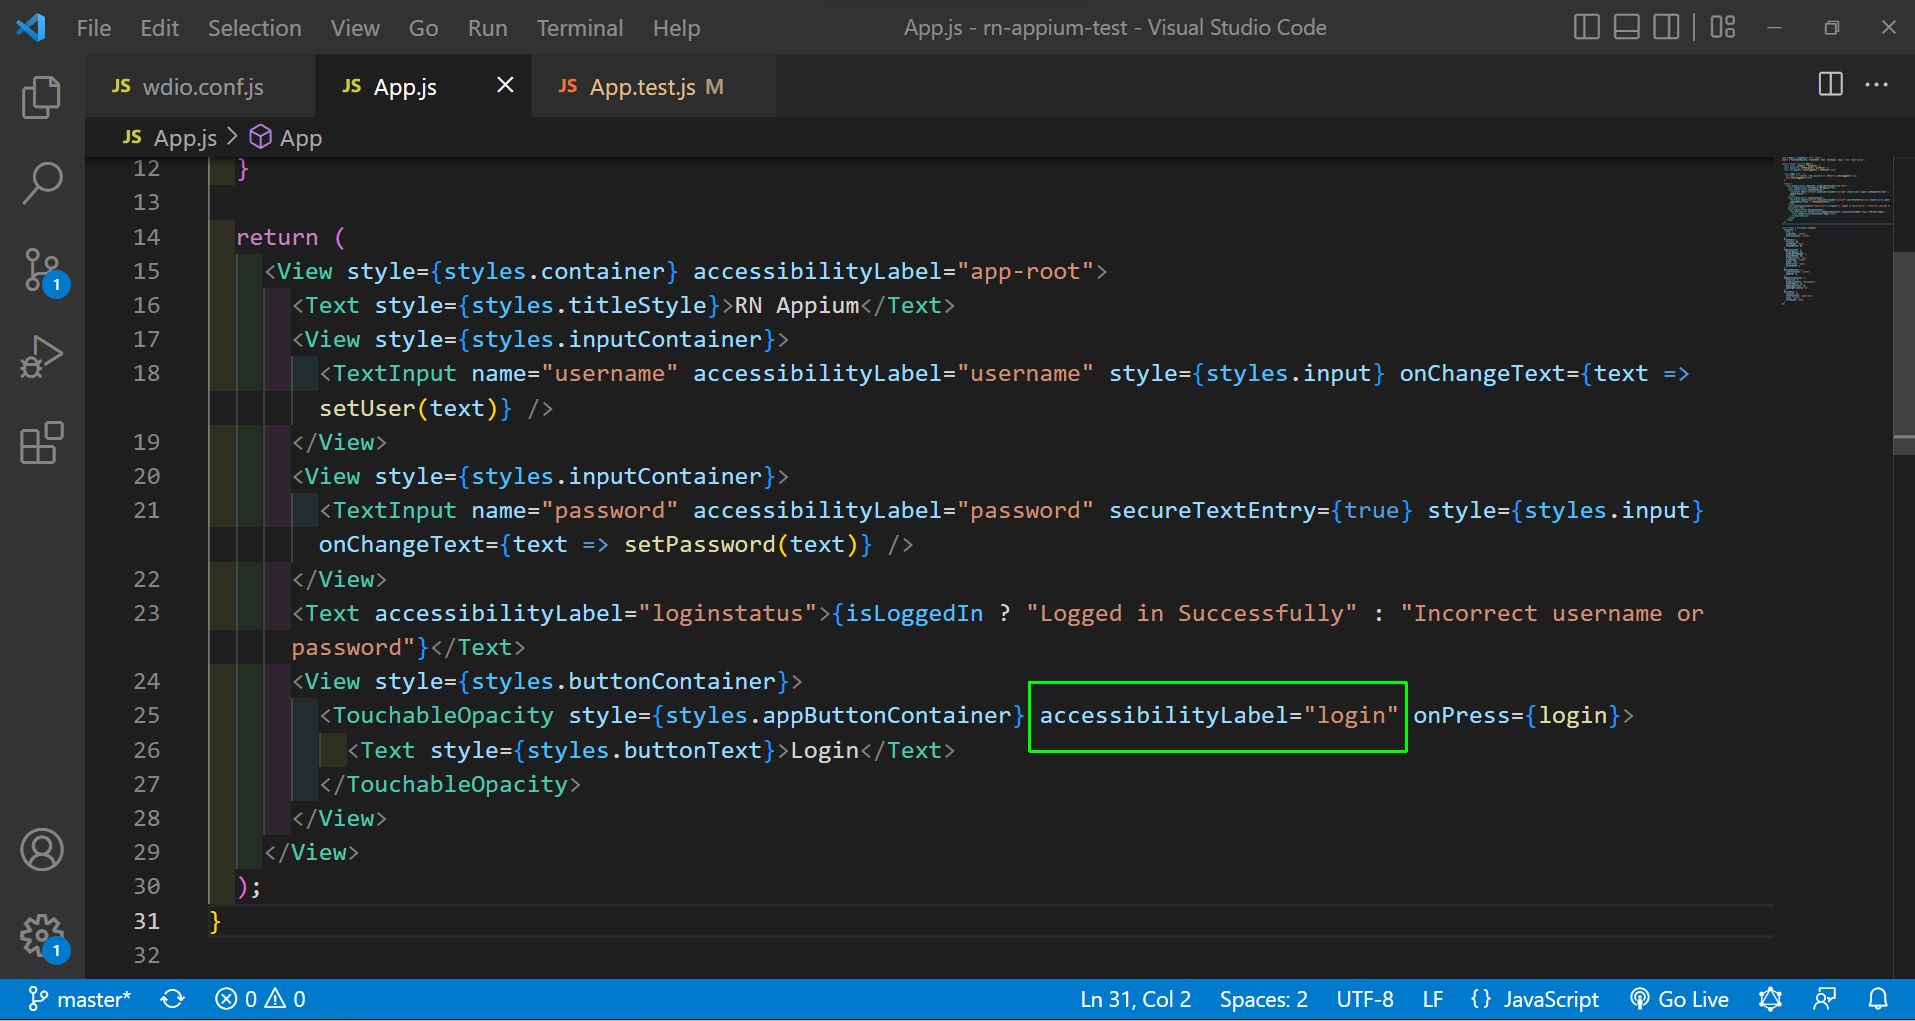
Appium also allows us to do a reverse search. Suppose we know the ID of an element from the code. In App.js, we can see the accessibility label of our login button ("login"), which is assigned to accessibilityLabel.
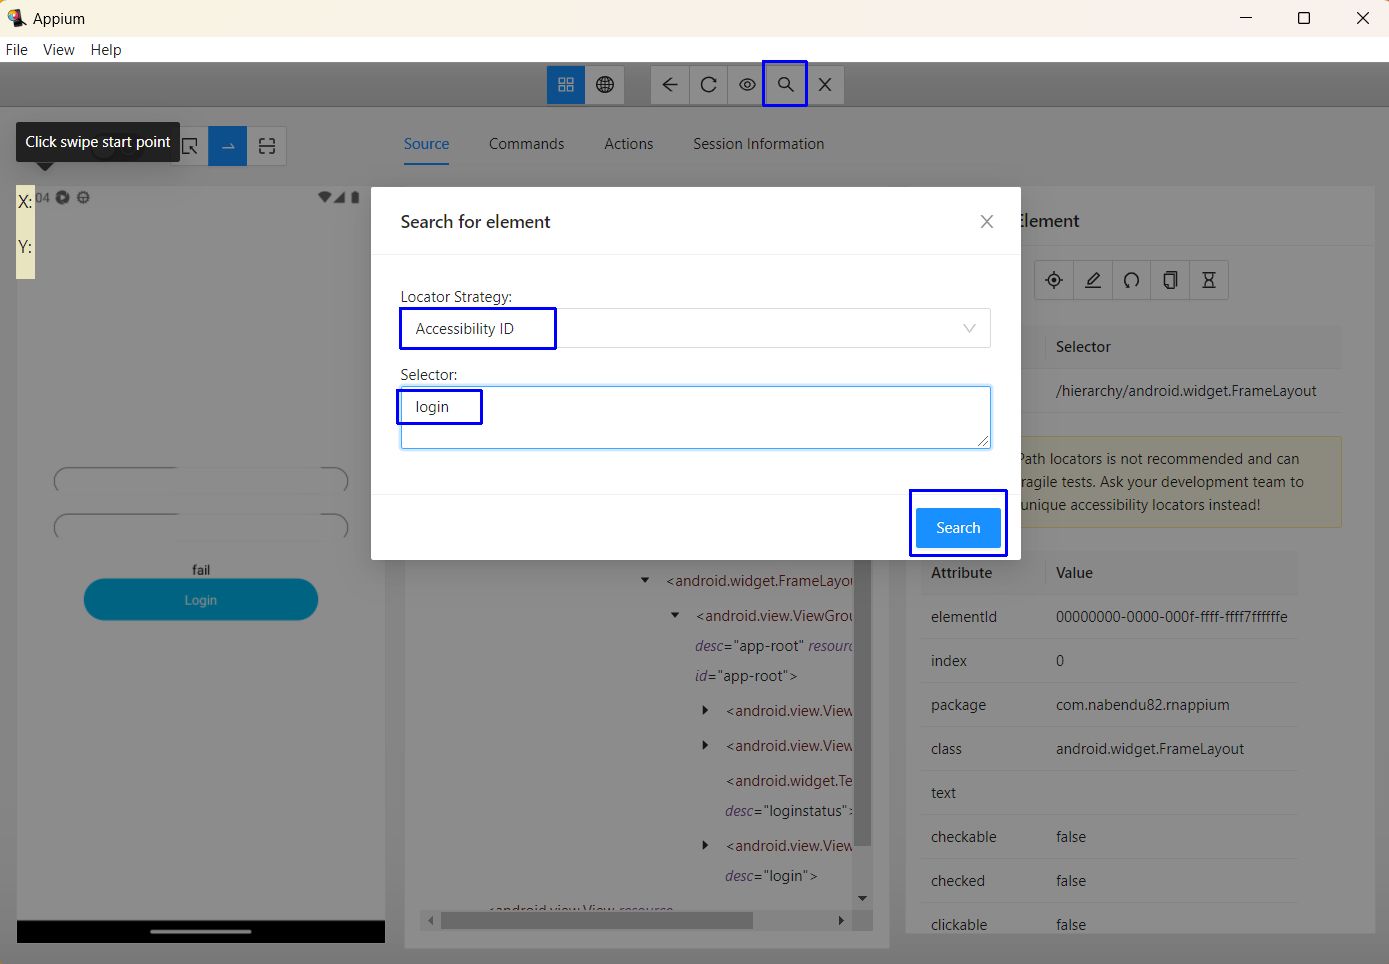
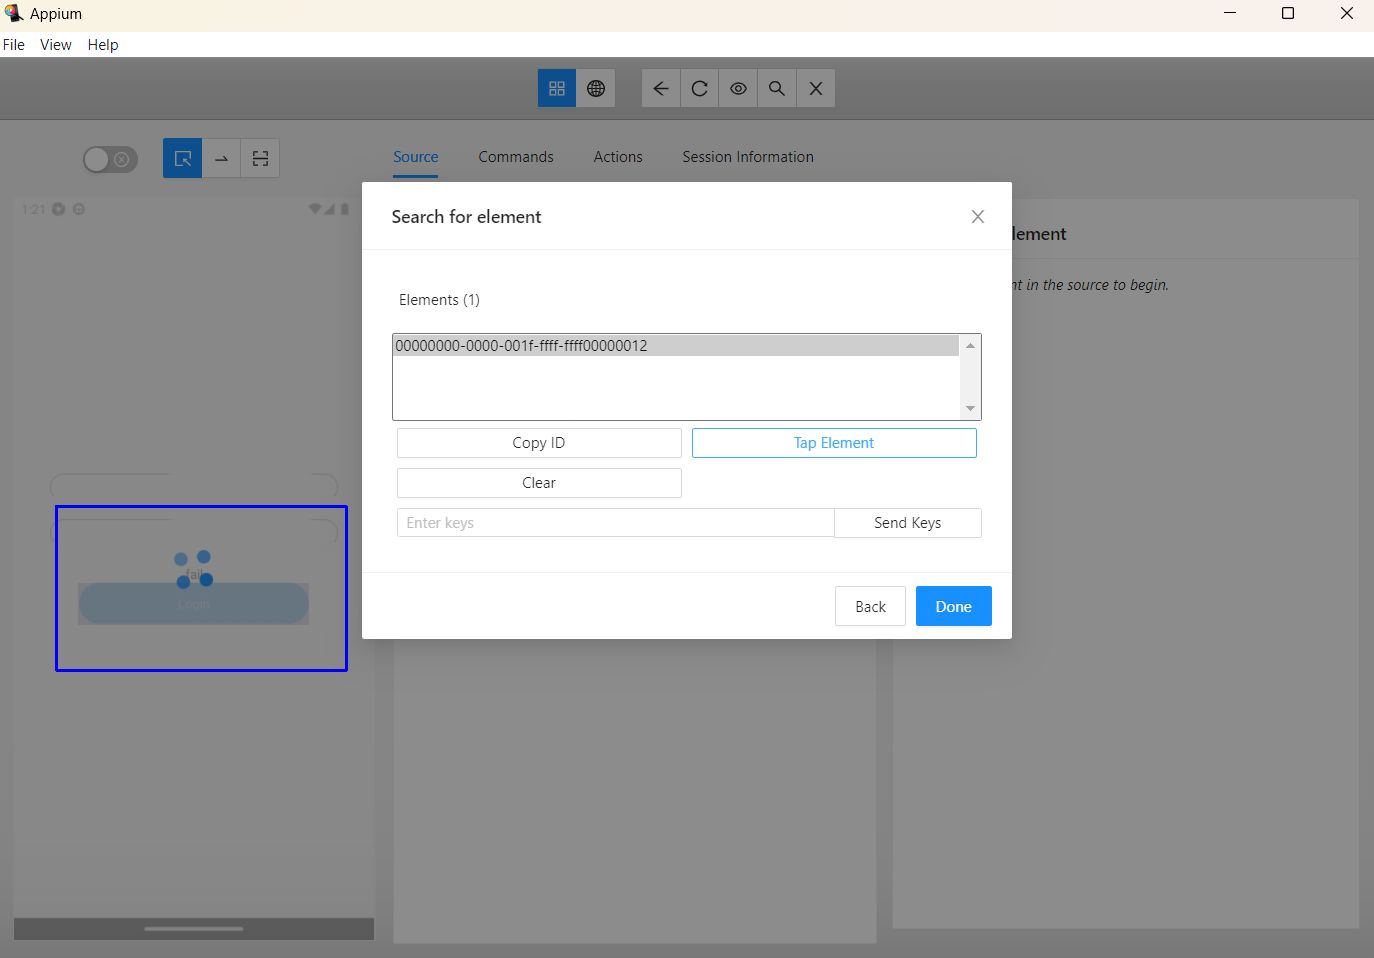
Now open the Search for element pop-up by clicking on the magnifying glass icon. Select "Accessibility ID" from the Locator Strategy drop-down and type "login" in the Selector field. After that, click on the Search button:
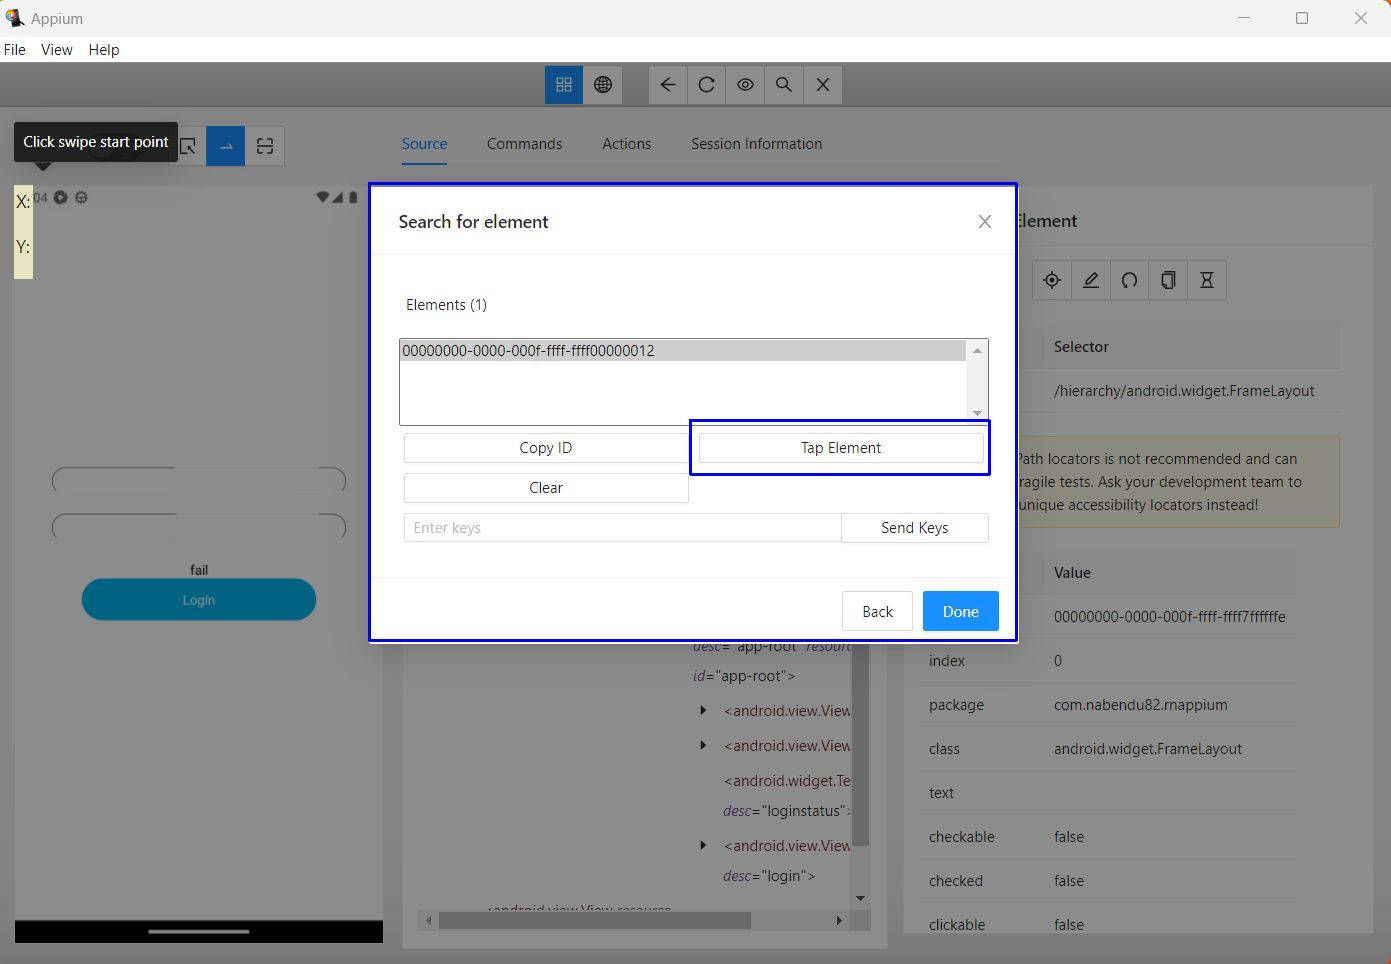
This will open a new pop-up and show us the elements. We have only one login element, so it is showing the ID. We can copy the ID for further use in our test cases.
But we can also click on Tap Element, and this will actually click on the Login button in our emulator.
We can see here that the Login button has been clicked and the test has been performed:
What We've Learned About Appium Inspector
In this post, we have talked about what Appium Inspector is and how it works. Then we installed Appium Inspector on a Windows system to check out its various features, like inspecting elements of a connected React Native app. We also looked at the recording feature of Appium Inspector.
If you want to test your apps more easily and without the hassle of going through all this setup, then you should try Waldo, which only requires you to provide the APK or IPA file. You're able to interact with the mobile app like a real user, and it will automatically generate the test cases and send you results via email.
Automated E2E tests for your mobile app
Get true E2E testing in minutes, not months.