


A great app is an app that doesn’t just look good, it also has to feel good. This means that your apps should have delightful animations, gorgeous designs, surprising interactions, and maybe most importantly of all, your app should be responsive.
When you think of an app that is responsive you’re probably thinking of an app that always immediately provides feedback to touches. When you scroll through a list in a responsive app, you should notice that there never seem to be any hitches, glitches, or jumps where the scrolling interaction just didn’t feel like it was fully controlled by you.
Once apps start growing in size and complexity, you’ll find that it gets harder and harder to solve performance issues through clever print statements, reading your code, and using your app. Your performance issues, just like your app, become more and more complex which means that you should turn to more sophisticated tools to profile and verify your fixes.
In this post, we’ll take a look at how you can leverage Instruments to gain new and interesting insights into your app.
Building your app and running it with Instruments
Once you determine that you want to profile your app, you’ll need to run your app in a slightly different way than you normally would. You should compile your app using the Profile option from the Product menu. Alternatively, you can press ⌘+I if you prefer using keyboard shortcuts.
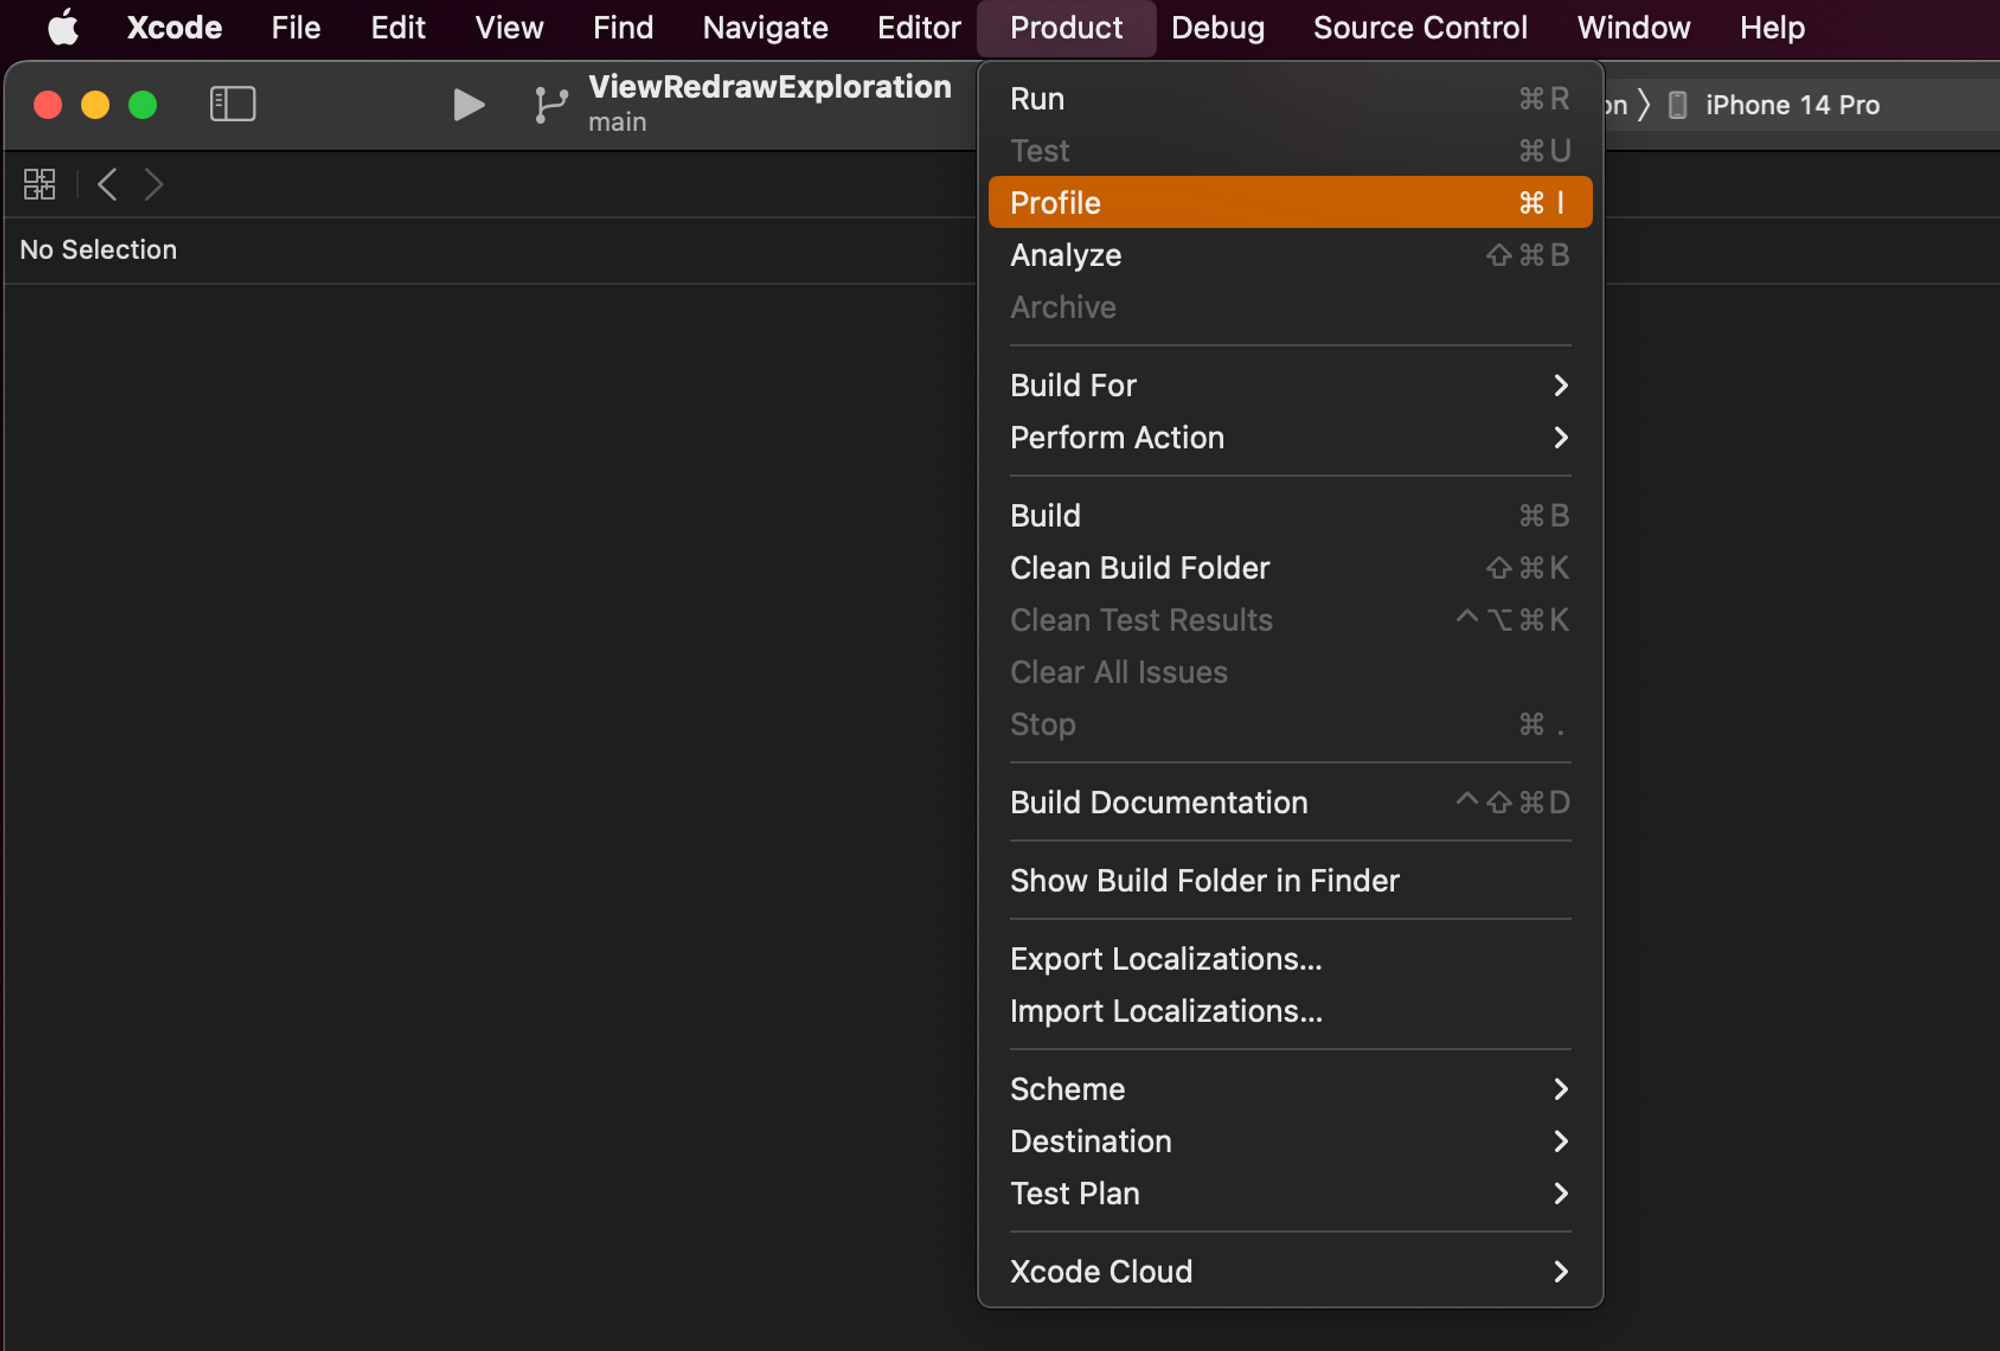
Performing this action will, by default, build your app in Release mode. This means that the app you profile will be essentially built using the same settings and configuration as the app that you ship to your users.
Important In this post I will be profiling using the simulator. Instruments supports profiling apps running on your device. Doing this is always the preferred approach when you profile an app. The simulator has the hardware from your Mac backing it. This means that the results in Instruments can sometimes vary wildly from what happens on a device.
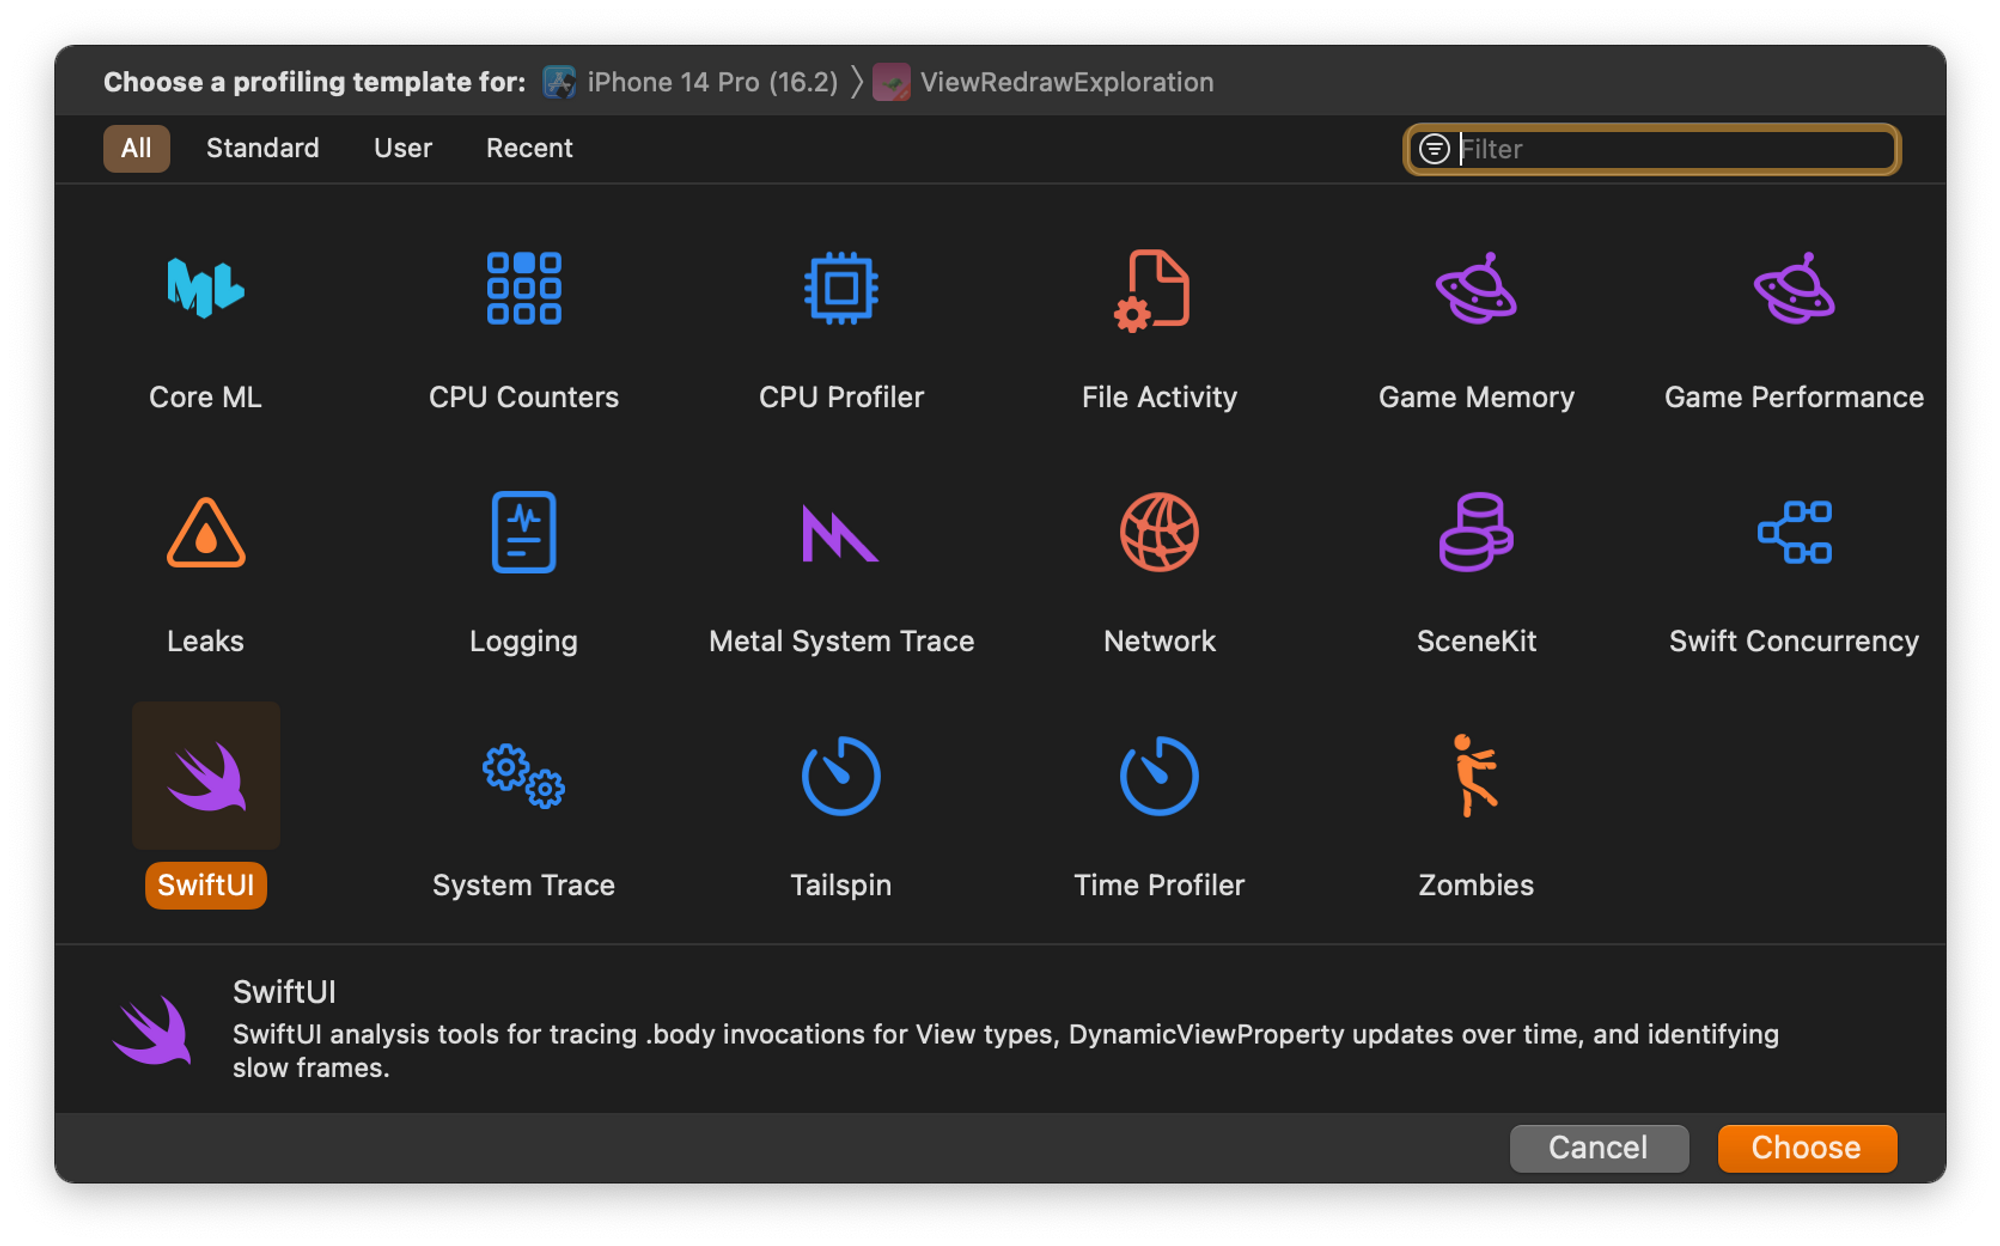
Once you’ve built the app, the Instruments app will open and you can choose from various profiling templates. To profile a SwiftUI app you’ll want to start by selecting the SwiftUI template.
After choosing the template you’re interested in, you’ll be presented the Instruments main window. In the top left corner there’s a record button. When you click that, your app will launch and Instruments will start profiling your app.
At this point, you’ll want to start interacting with your app and perform the actions that you want to profile. Instruments will record various data points during this process. Once you’ve gathered the data you’re interested in, you can click the stop button in the top left of Instruments’ window to end the recording.
Now that we have some data to look at, let’s explore the different lanes of information that Instruments shows, starting with the top one.
Exploring the View Body lane
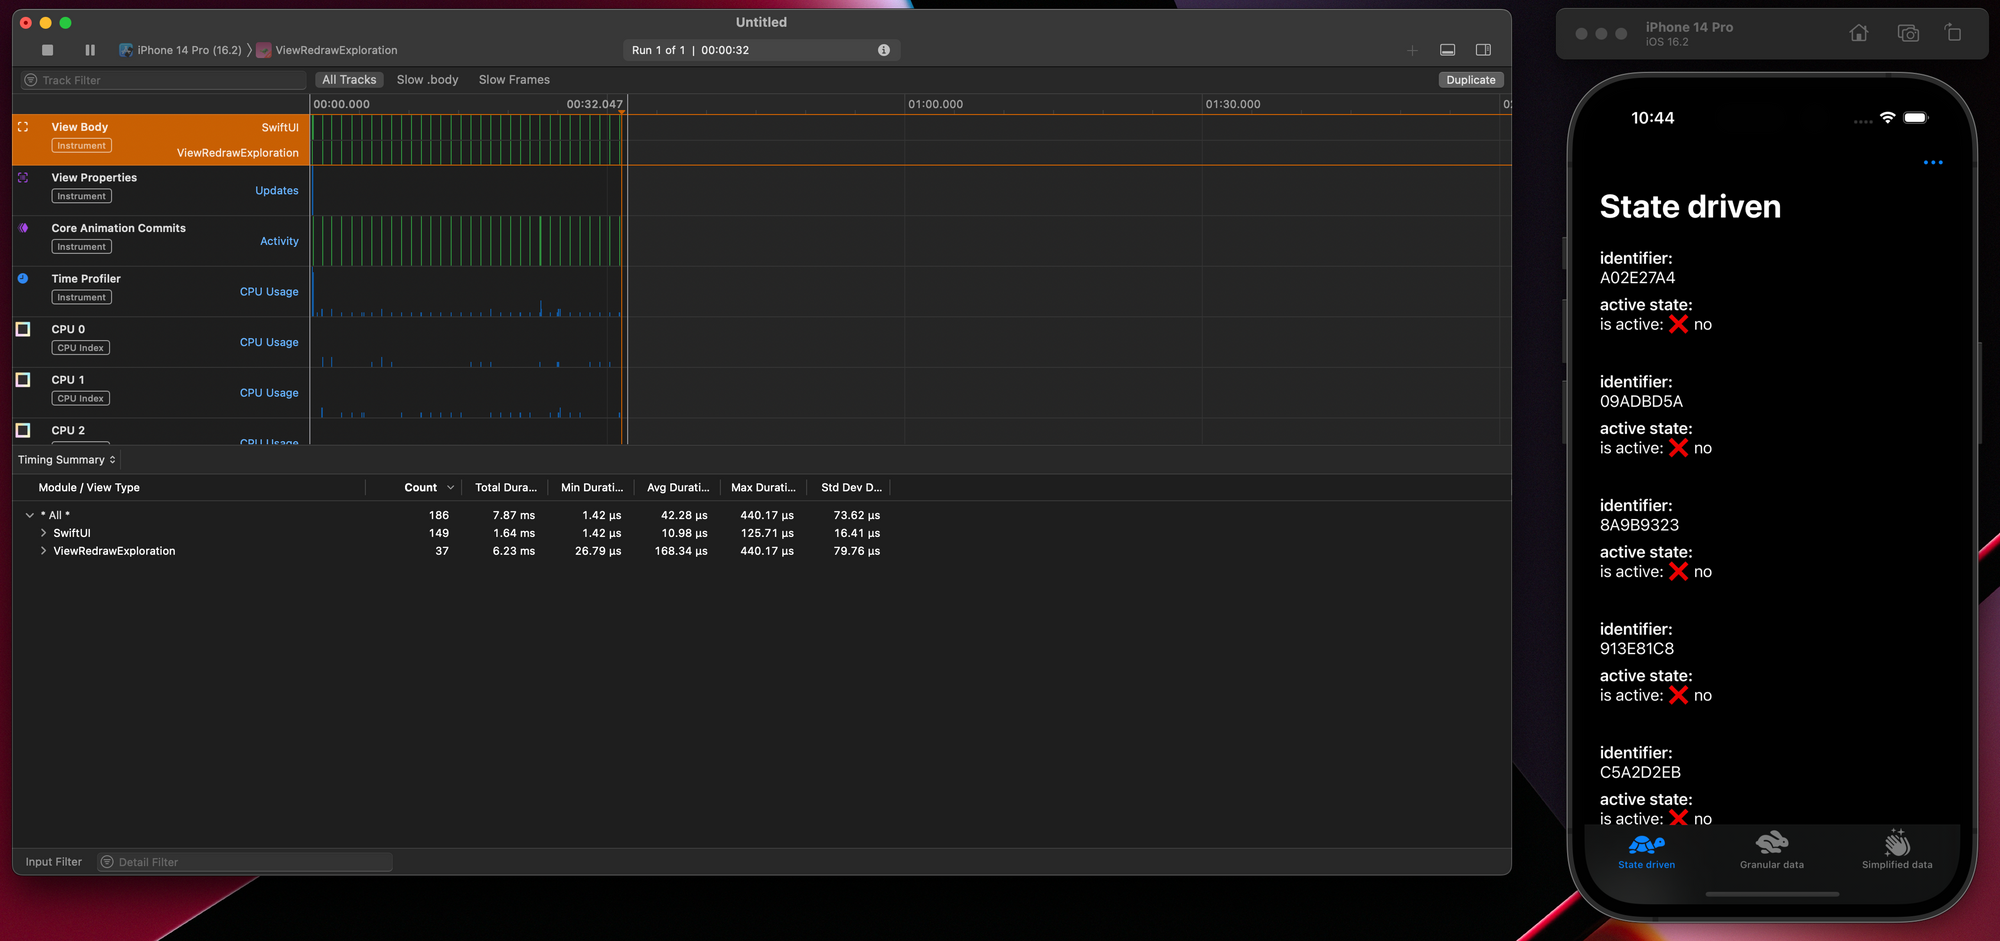
The topmost lane in the SwiftUI Instrument show is the View Body lane. SwiftUI records which view bodies it accesses, and how long each access takes. This information is presented in the View Body lane.
You when you select this lane, Instruments will show an overview of the bodies that were evaluated during the entire recording. When you expand the information that’s related to your app you can see which of your views were evaluated. You can see how often each view subclass was evaluated, how long all evaluations took when they are added together, as well as how long the quickest, slowest, and average body access took.
If you’re interested in profiling a specific interaction, animation, or moment in time, this view is way too broad. After all, it shows you everything that happened for the entire recording.
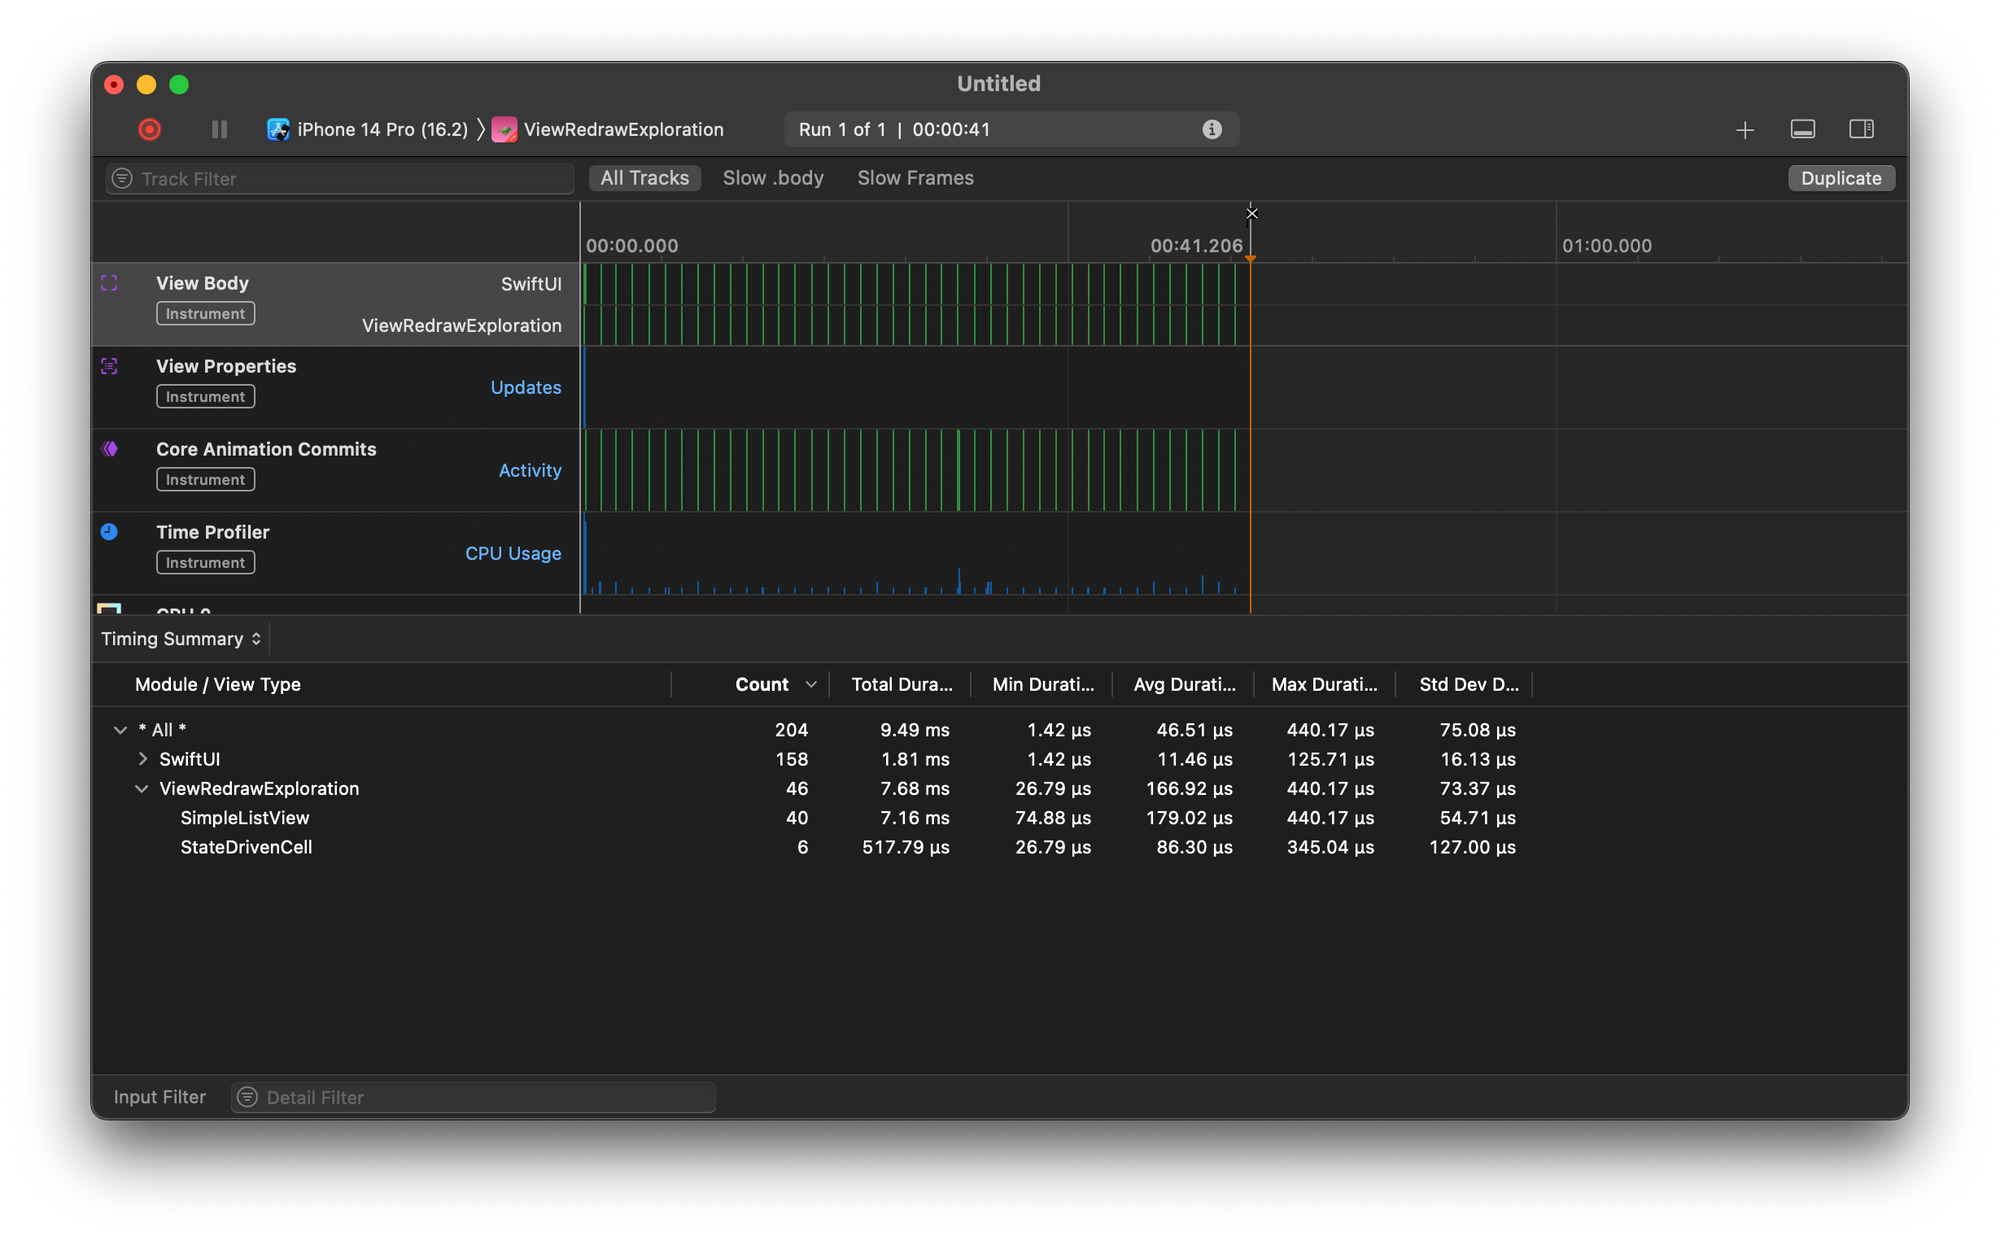
Luckily, you can zoom in on a part of the recorded data. Click inside of the top lane and drag to select a period of time. The bottom panel will now only show body evaluations that occurred during the selected timeframe.

Whenever SwiftUI evaluates a view body, this tells you a couple of things:
- One or more properties on the view have changed
- Or one or more observable objects in the view triggered their objectWillChange publishers
- SwiftUI will do work to redraw this view
Before SwiftUI evaluates a view’s body it does a comparison of the view’s properties to make sure that it can reasonably assume that redrawing the view will result in a new visible state.
So when you see more view bodies than you expected, or if you see bodies for views where you’re convinced that the data hasn’t changed, you know what to look for. Something in your code is definitely changing in a way that causes that view to change on of its properties.
The tricky part is that there’s a decent change that none of the view properties have actually changed. Or rather, none of the properties needed by your view. If your view observes an observable object but doesn’t use some of its @Published properties, that view will still redraw when one of those unused @Published properties changes.
The View Bodies lane is a super useful tool to help you figure out if SwiftUI is doing more work than it should.
Exploring the View Properties lane
The View Properties lane is useful when you’d like to gain some insights into how your view’s properties behave. It shows your views, the view’s properties, and the current value for these properties in a list. This allows you to inspect your app’s current state at the location of the marker shown in the image below.
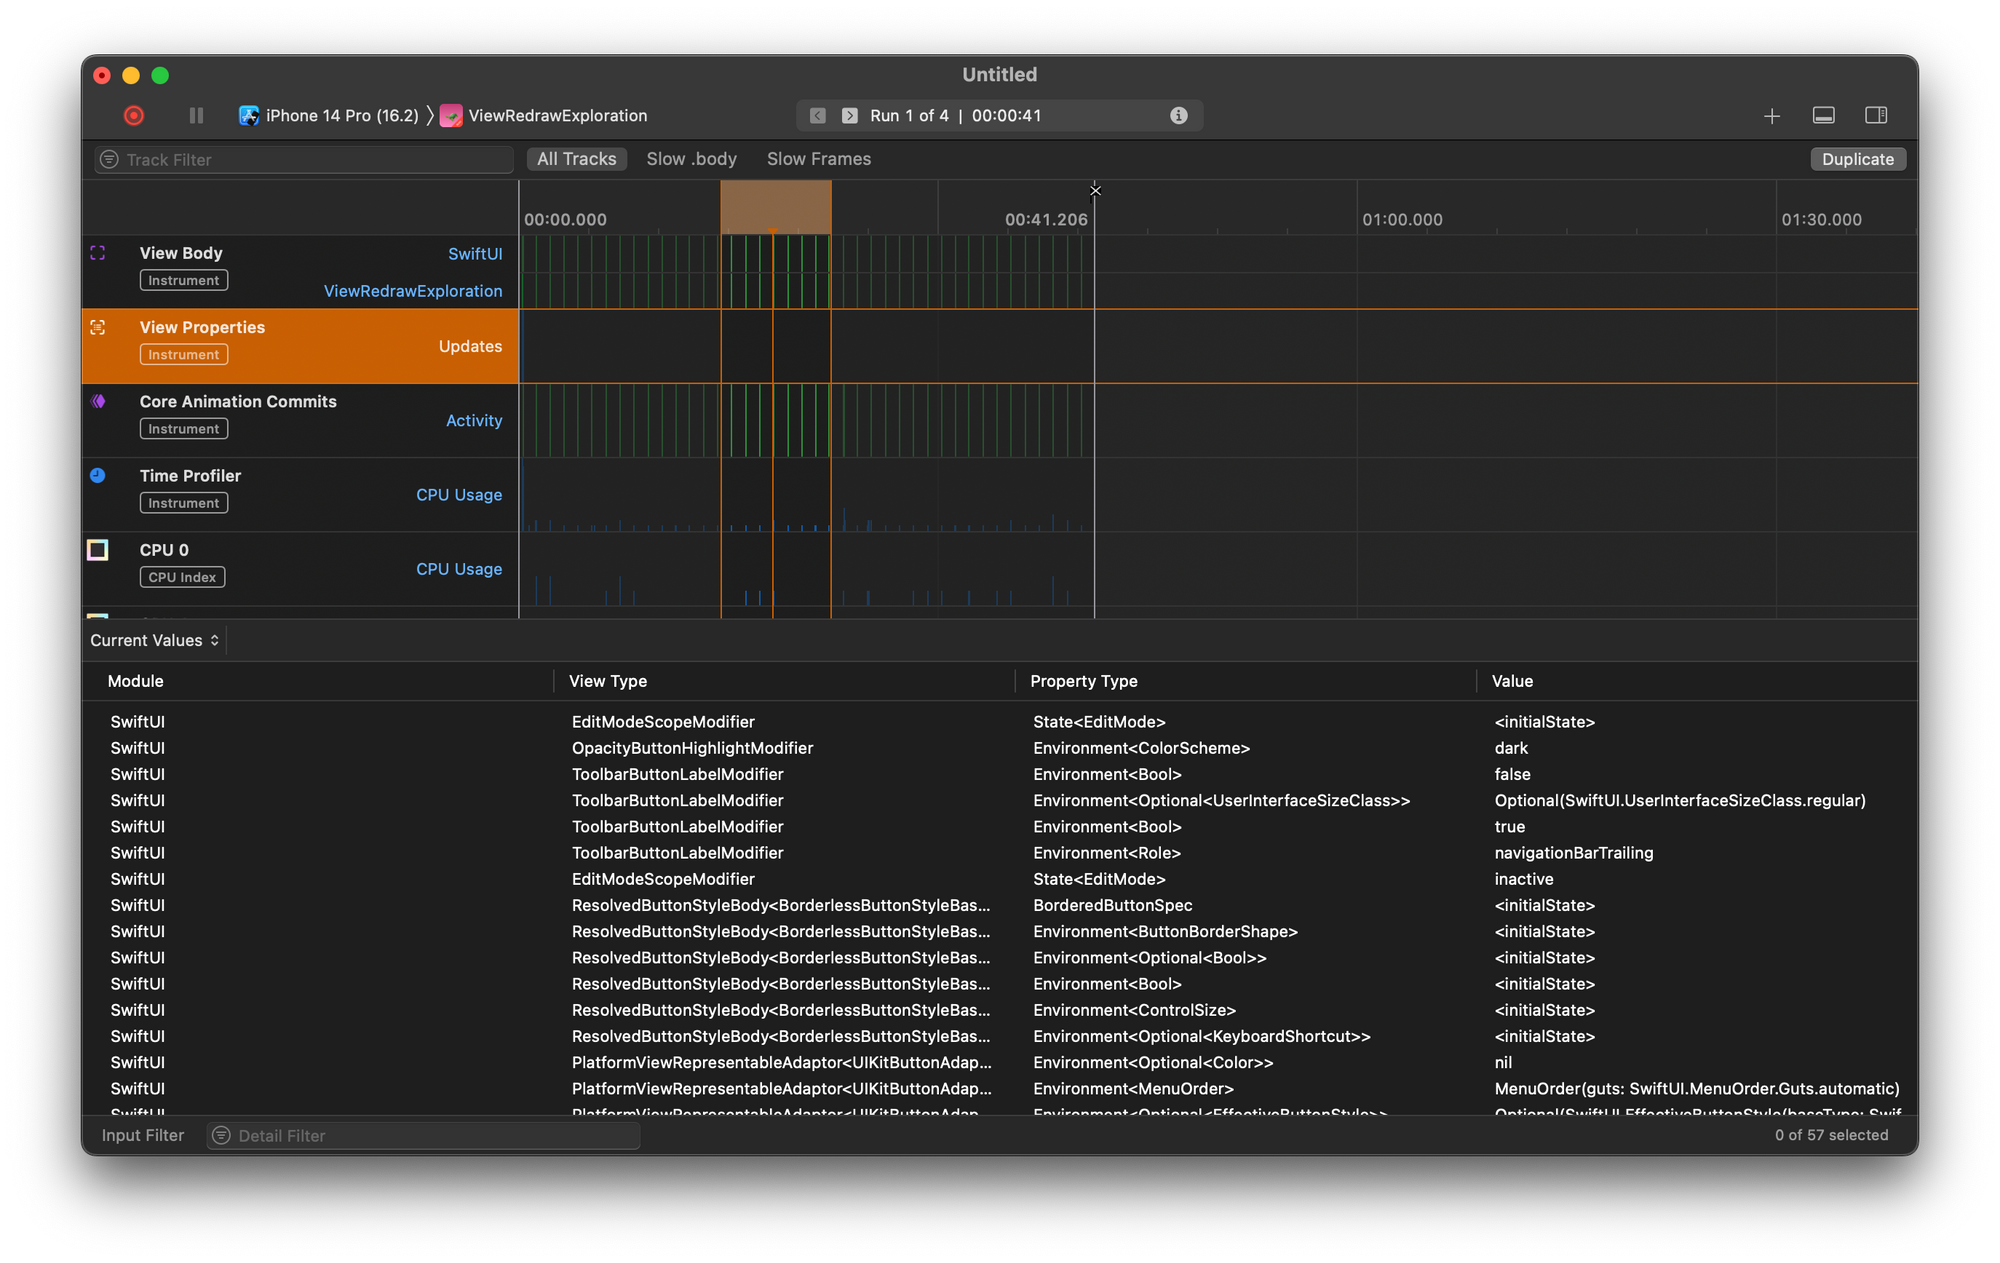
Click on different points in time to see the current values for your state at the marker’s location.
When one or more of your view’s state related properties update, you will be able to see these values change as you move the playhead around. This is quite neat, but unfortunately you can’t always clearly see which properties on which view have changed. You can only distinguish properties by their type but it’s not clear when two properties belong to the same view instance or to a different one.
This lane is useful to keep an eye on but it doesn’t give as many insights as the bodies lane.
Understanding the Core Animation Commits lane
The Core Animation Commits lane is relatively low on information. It shows us how many Core Animation Commits our app made during the selected time interval, and how long these commits took.
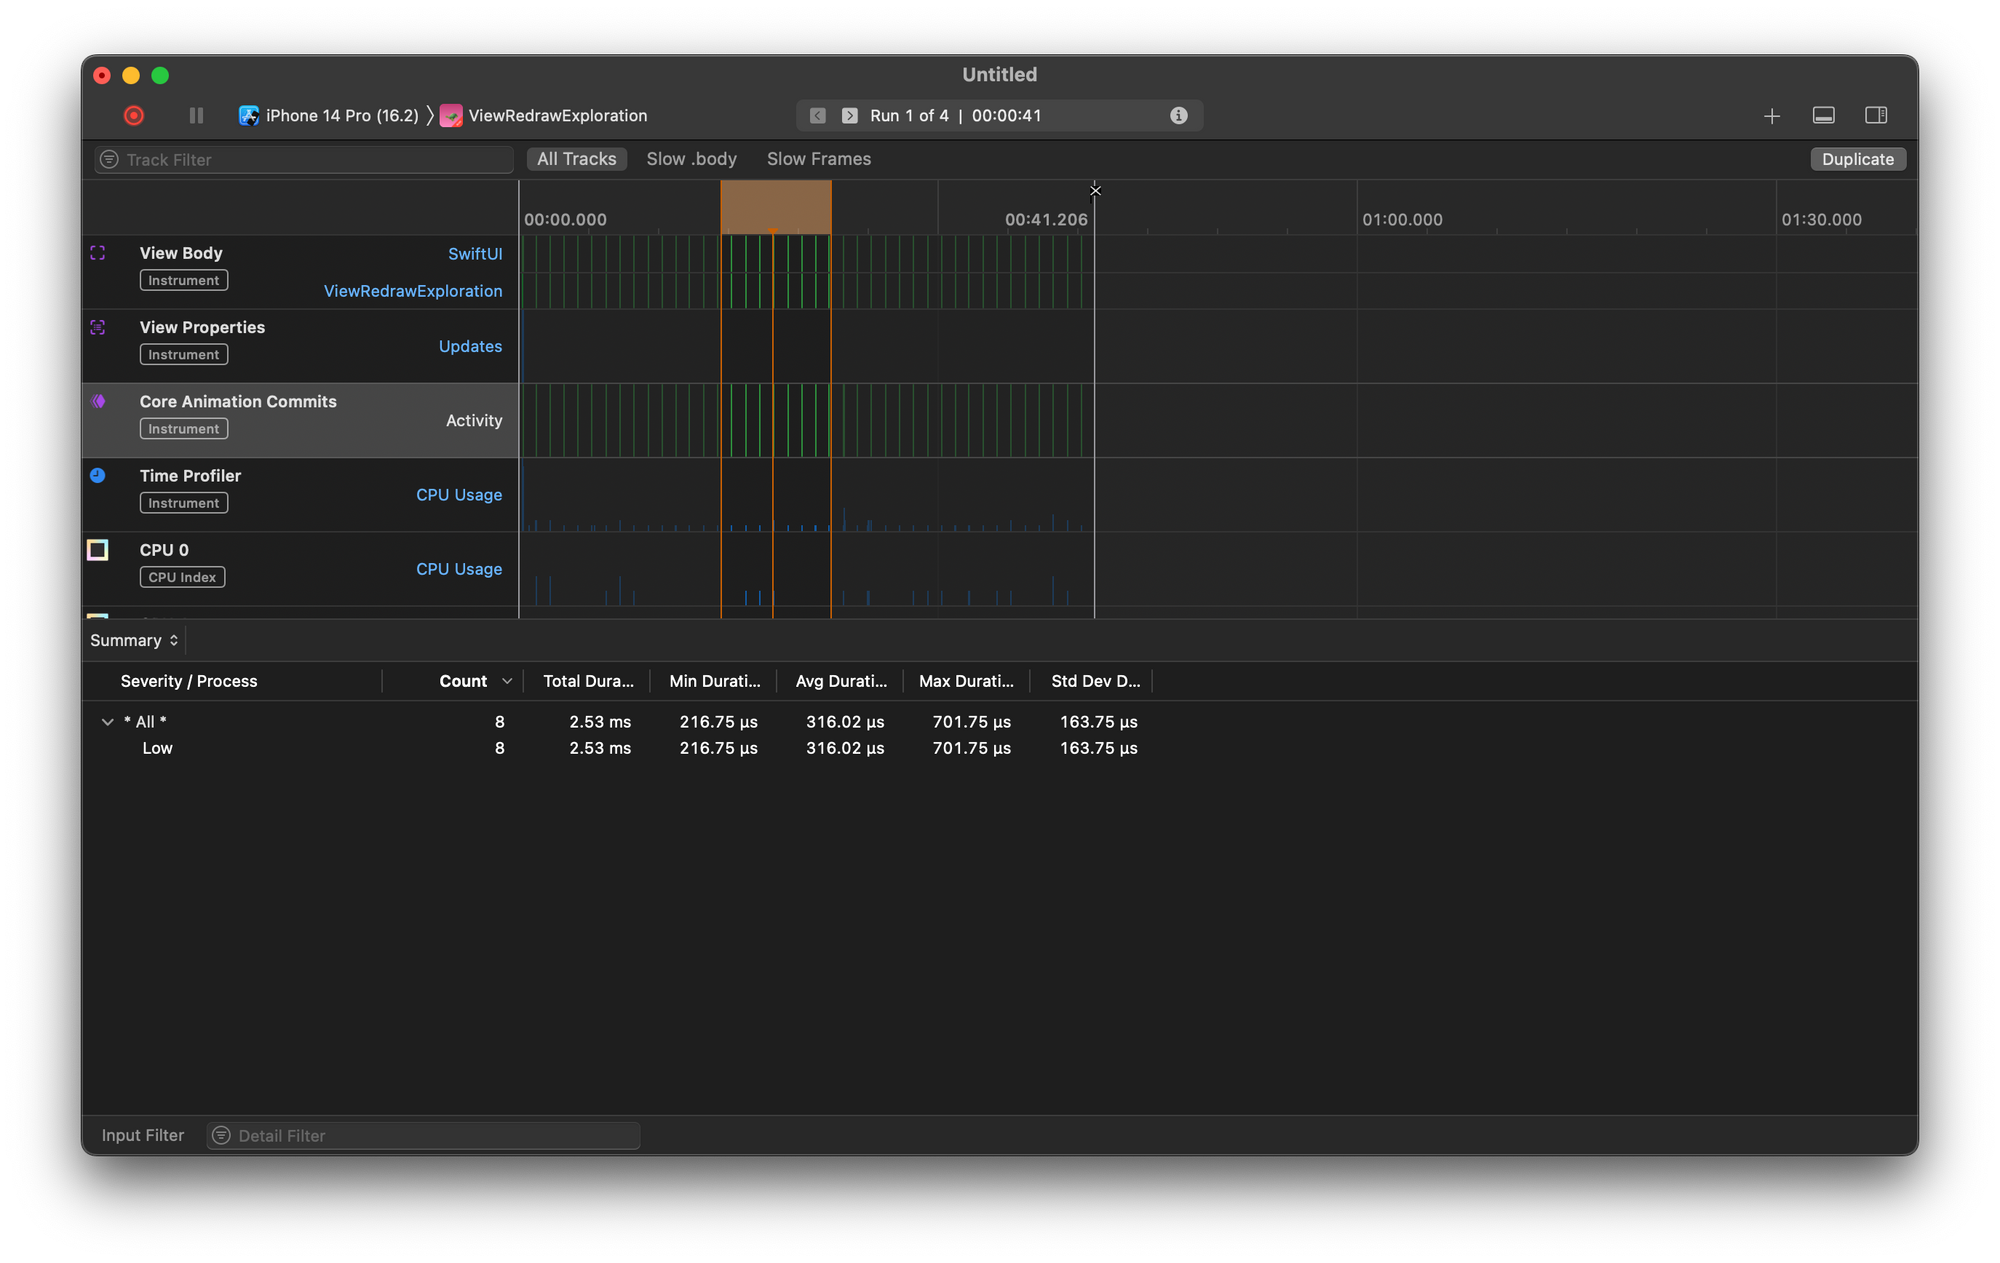
This lane is particularly useful to inspect when you have some UI related performance issues in your app and you’re wondering whether certain views are causing heavy Core Animation Commits. A Core Animation Commit will result in your device’s GPU doing work to redraw or update the screen. So when you see a Core Animation Commit, you know you’re dealing with a redraw.
When you see many commits happen, or when you see slow commits, look at the View Bodies lane to figure out which views are causing issues. Which views are being redrawn during a slow commit? If these views represent a huge area in your layout, or if they’re complex with a large body, it might make sense to see if you can split that view up into smaller views that observe less state.
Smaller views will ultimately require less work to evaluate, and if they also take up less room in your UI that means there’s fewer pixels to draw.
The Core Animation Commits lane is quite useful to help you find and resolve large redraws simply because it flags expensive UI work in a pretty clear manner.
Understanding the Time Profiler lane
The Time Profiler lane is super useful if you’re wondering which functions your app calls during an animation, in response to a button tap, or while evaluating a view’s body.
The Time Profiler takes a snapshot of what your CPU is doing in very short intervals. These intervals are so short that we can super accurately determine how long a certain function call took. Because everything that’s on CPU is snapshotted, there’s tons of data in the Time Profiler lane.
Usually what you’re looking for is a view of functions that exist in your code so you can see which of those functions are potentially slow.
The best way to surface your own code in the Time Profiler lane is by selecting it, clicking Call Tree at the bottom of the screen, and then choosing the following options:
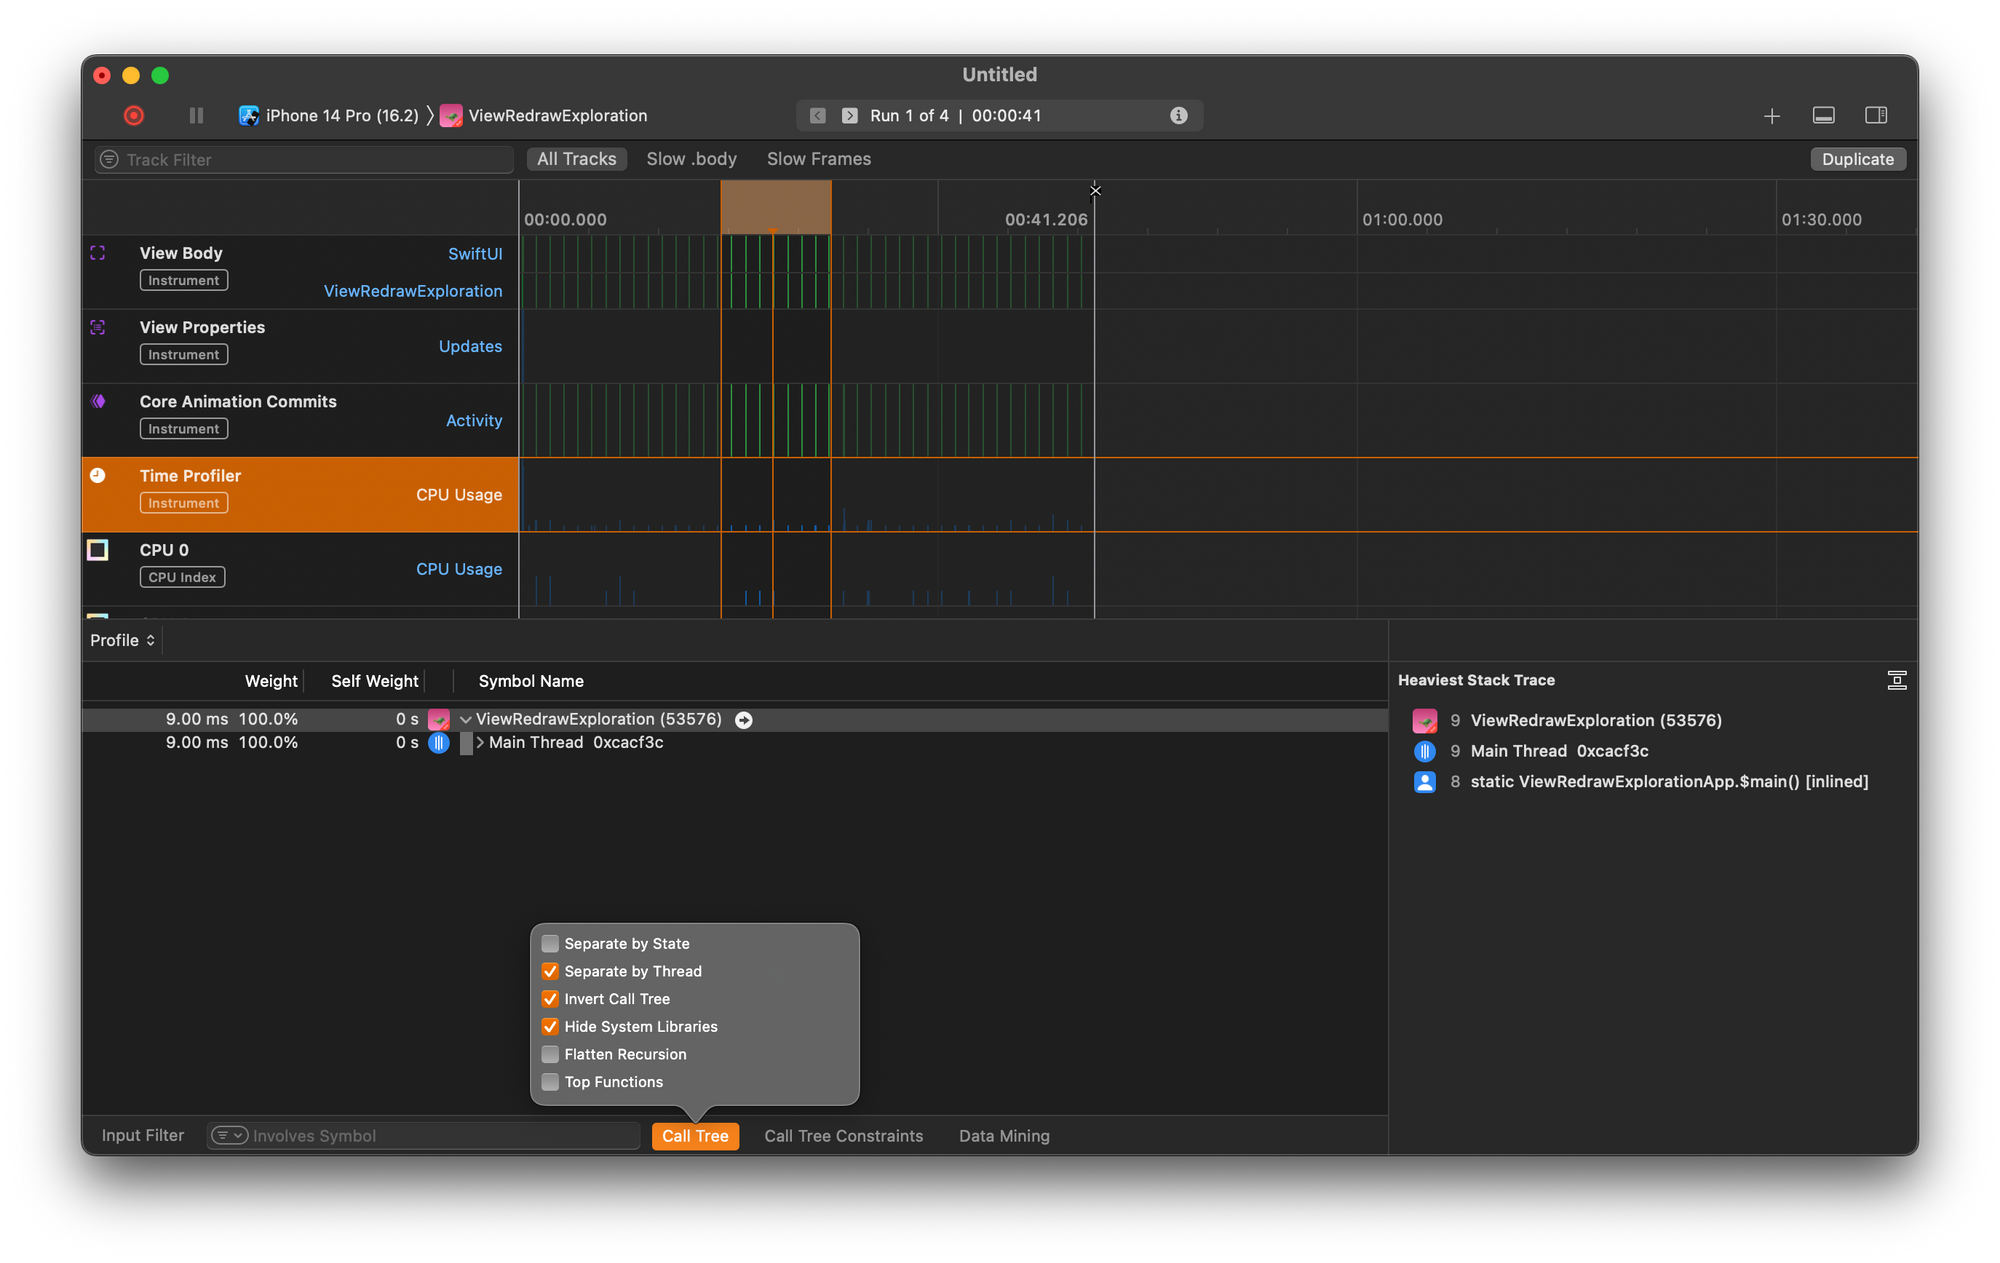
These options create a very nice overview of what’s happening in your code per thread. Once you expand the Main Thread, you’ll see something like this:
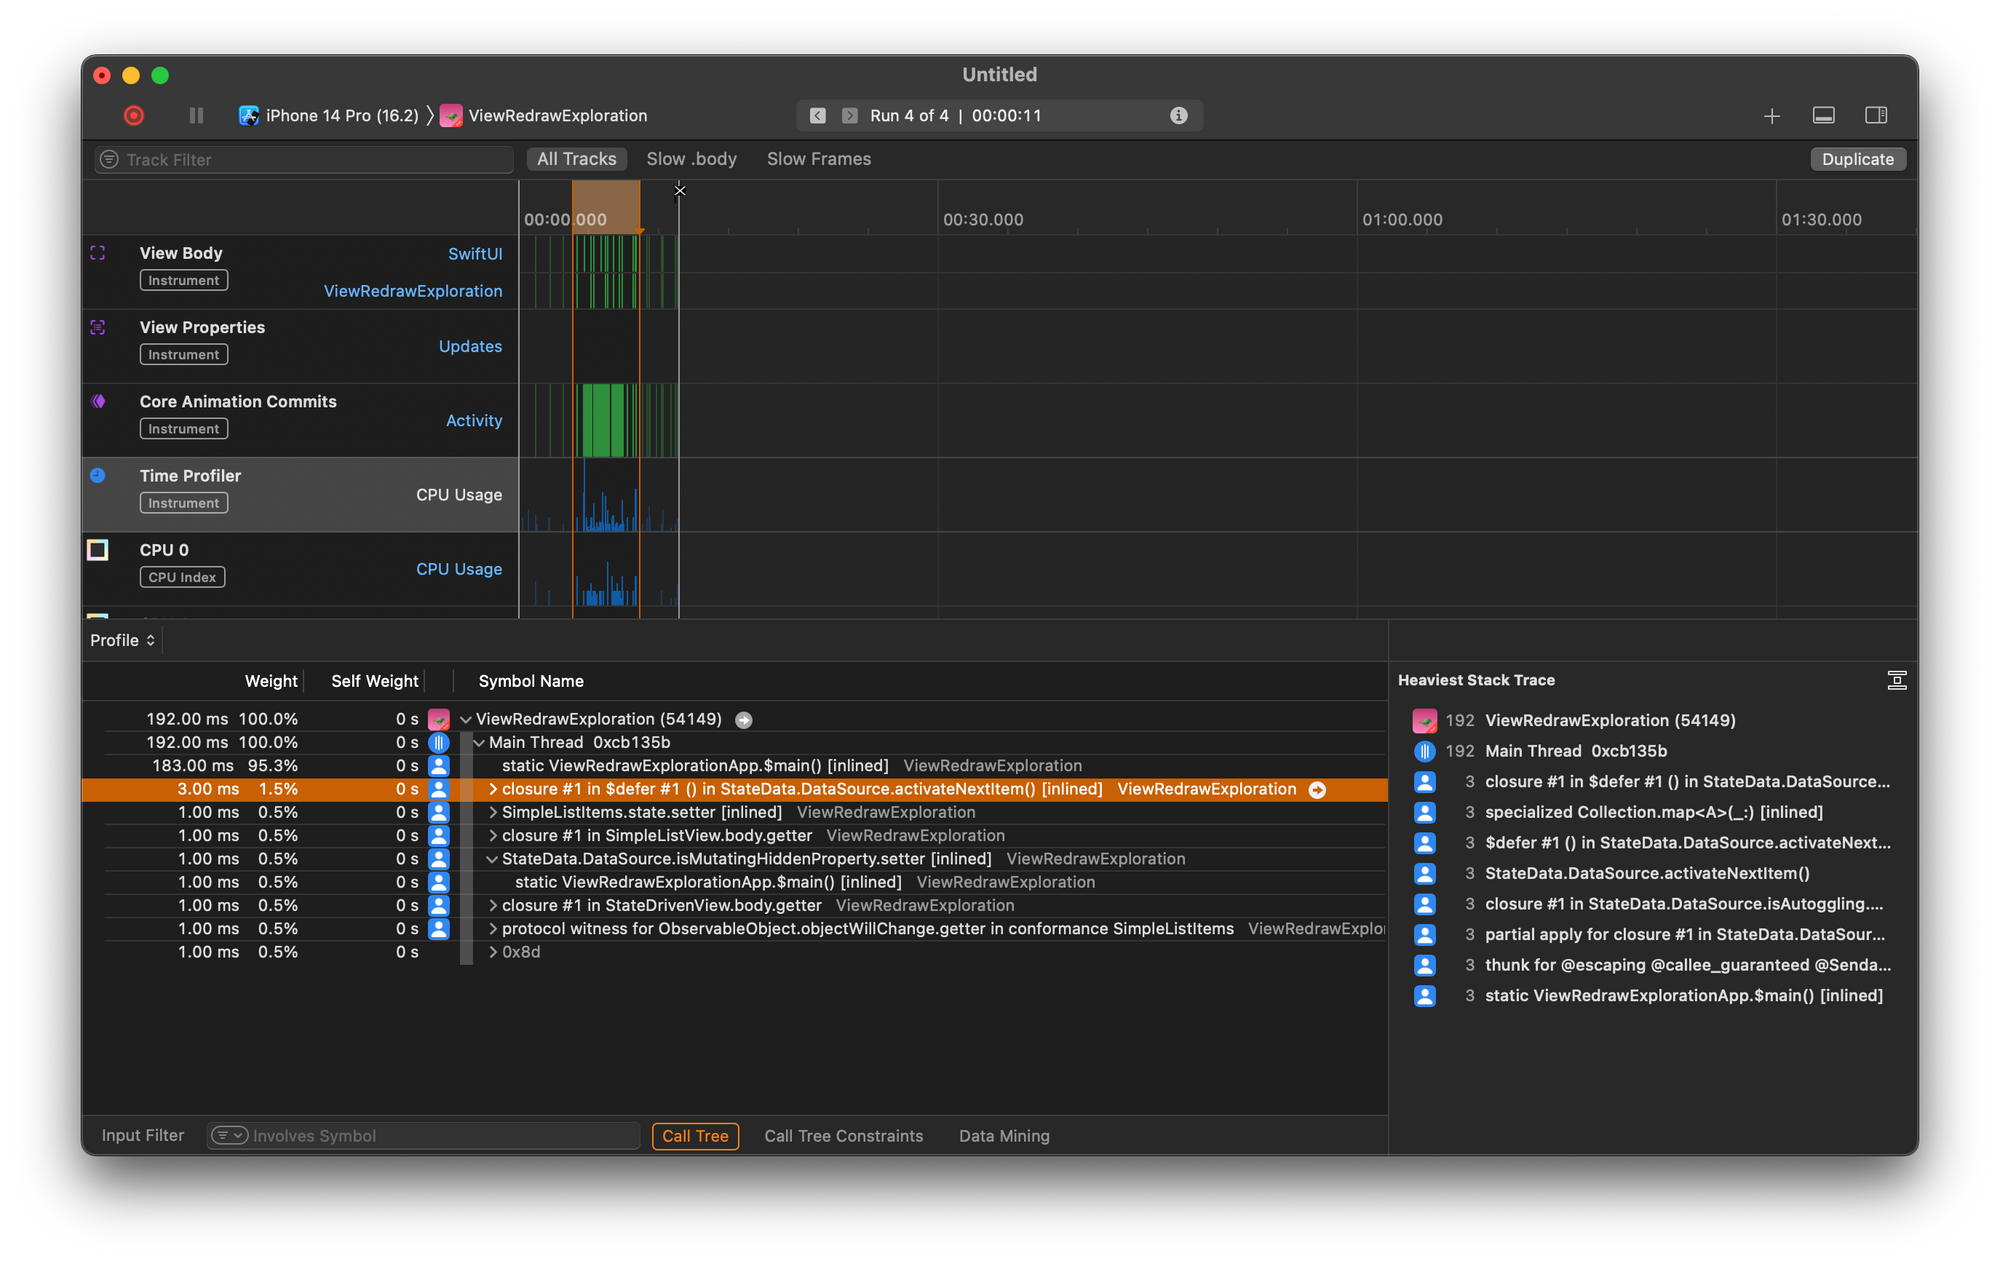
You can see every function and closure that’s ran during the selected timeframe, and how long that code ran for. Note that you can’t easily see the number of times that a given function ran so you’ll want to select an as small as possible window of time where you can analyze exactly what happens in response to a specific button tap for example.
In Summary
Profiling your code is an essential part of building extremely performant applications. During early stages of development you might be able to leverage your common sense, your eyes, and some small refactoring to improve your app’s performance.
However, as your app grows in complexity it will be harder and harder to confidently reason about everything your app might be doing at a given moment in time. At this point, Instruments is an indispensable tool that helps you gain detailed insights into everything your SwiftUI app is doing.
Start by looking for slow view bodies or view bodies that are evaluated when you don’t expect them to be. Then look at the Core Animation Commits lane to see if what you’re doing is resulting in heavy redraws. Use the View Properties lane to analyze property updates and see if your app’s State looks more or less as expected. And lastly, look at the Time Profiler to see if you have any functions that should be optimized to execute much faster.
Instruments offers lots of other profiling templates and tools so it’s highly recommended to explore those too. That said, the SwiftUI template provides a fantastic starting point for you to learn more about your app’s performance.
Automated E2E tests for your mobile app
Get true E2E testing in minutes, not months.


