.jpeg)
This article will discuss how to successfully add charts to a Flutter app. I'll start by showing you what kind of chart libraries are available and what they have to offer. Then I'll walk you through the process of implementing your library of choice into a Flutter app. Next, we'll create a simple bar chart with basic data together. And finally, I'll show you how to display different kinds of charts in your app. By the end, you can expect to have a fundamental understanding of how to integrate a library into a Flutter project. Additionally, you'll have the skills to implement and display multiple kinds of charts.
This article was written for developers with a solid foundation in Flutter development. Consequently, if you don't have a reasonable level of mastery in the technology or have not worked on it yet, please spend some time developing your skills.
Choosing a Library
Before jumping into the implementation process, you need to choose which library to use. Unfortunately, not all libraries provide all the necessary features and tools, and some are better for implementations targeting specific platforms (i.e., iOS, Android, web). Therefore, it's very important to choose the right tool for the job.
We'll use charts_flutter since it's the most straightforward and documented library to date, but here are a few good contenders for you to consider in case you would like to go another route.
FL Chart
As the GitHub repository states: "FL Chart is a highly customizable Flutter chart library that supports Line Chart, Bar Chart, Pie Chart, Scatter Chart, and Radar Chart." It provides a selection of chart options that are pretty responsive and modern looking. It's updated frequently and has a good reputation in the Flutter community.
.png)
multi_charts
The multi_charts library is "A flutter package which makes it easier to plot different types of charts with lots of customization, made purely in dart." Even though this library provides different types of charts to plot data points, it currently only supports Radar Chart. But the developer has stated that it will support more types of charts in the future. If you only need a simple way to display data, this might be the best option.
charts_flutter
charts_flutter is a fantastic library that provides great chart widgets in Flutter. The implementation is dead simple, and the selection of flutter charts is satisfactory for most use cases. Additionally, Google developed it and maintains it, so it offers the best integration and support possible for your projects.
As mentioned before, we'll be using charts_flutter in this article, so keep reading if you decide that's the best option for you.
Implementing Charts in Flutter
Alright, so the first step to implementing charts_flutter into an application is to add the dependency in the pubspec.yml file. All you have to do is open the file and add the following line under dependencies and run the "flutter pub get" command to load it:
Conversely, you can use the "flutter pub add" command and specify the dependency to add, which in this case is the charts_flutter package, and Flutter will automatically add the dependency to the file and load it into the project.
Pretty neat.
Now all you have to do is add the include directive in any class file you want to use it in.
.png)
Bar Chart
Now that you know how easy it is to integrate the library into a project, let's create some charts.
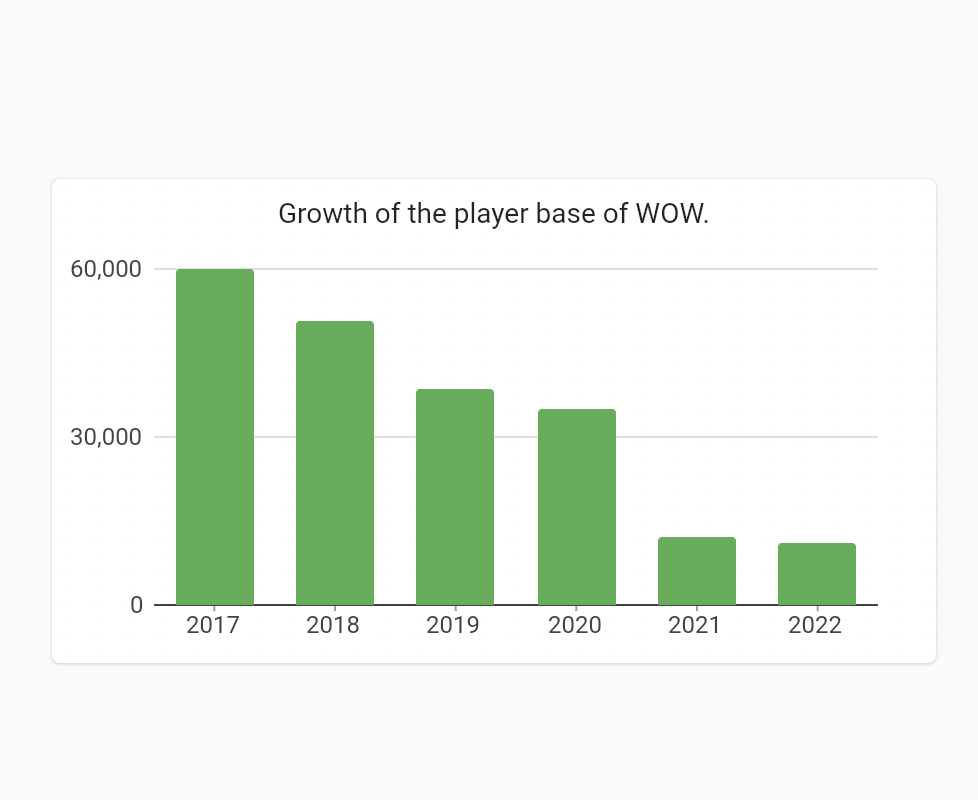
First, create a simple bar chart to plot some information for users to see. To accomplish this, let's make some data for the charts.
In order to create data that charts can actually use, you need to understand what the terms "series" and "models" mean. They're both commonly used with Flutter charts and are necessary to make the charts work. Essentially, a series is the data or collection of data used to plot charts. A model is the formatting assigned to data to specify attributes that each item in the collection must abide by in the chart.
Don't worry if it's not clear. You'll get it once you see the code below.
For this example, we'll plot the number of active players in the World of Warcraft game over the last six years.
The model defining the format will include the following:
- The year
- The number of active players in that year
- The color of the corresponding bar
So first, create a file named player_series.dart in the /lib directory and include the following code:
This code is pretty self-explanatory and should be easy to grasp. It merely represents the structure of the player data.
Now, create a file called home.dart in the /lib directory, which will be the application's homepage. You can skip this step if you already have a view where you want to display your chart.
Once you've created this file, add the following code:
Notice that we've added an array of PlayerSeries and manually inputted the data. If you have a service providing this data or if the data comes from user input, you can modify this code accordingly. Finally, we provide the data to a PlayerChart class that we haven't created yet. So let's do that next.
Create a file called player_chart.dart in the /lib directory and add the following code:
There's some confusing code here. Let me explain.
The series list contains the structure for the chart library to plot the chart. This structure requires several parameters: id, data, domainFn, measureFn, and colorFN.
- id: is the ID of the chart.
- data: refers to the array of items to plot on the chart.
- domainFn: refers to values that will lay on the chart's x-axis.
- measureFn: refers to the amount displayed on the chart's y-axis.
- colorFN: indicates the color of the corresponding bar.
Notice that we're providing domainFn, measureFn, and colorFN with functions. These functions take the series as an argument, create an instance of it, then use it to access its different properties.
Finally, we have the actual widget, which contains the structure of the card containing the chart itself.
And that's it. You can run the code and see your chart in action.
Quite simple, right?
Other Charts
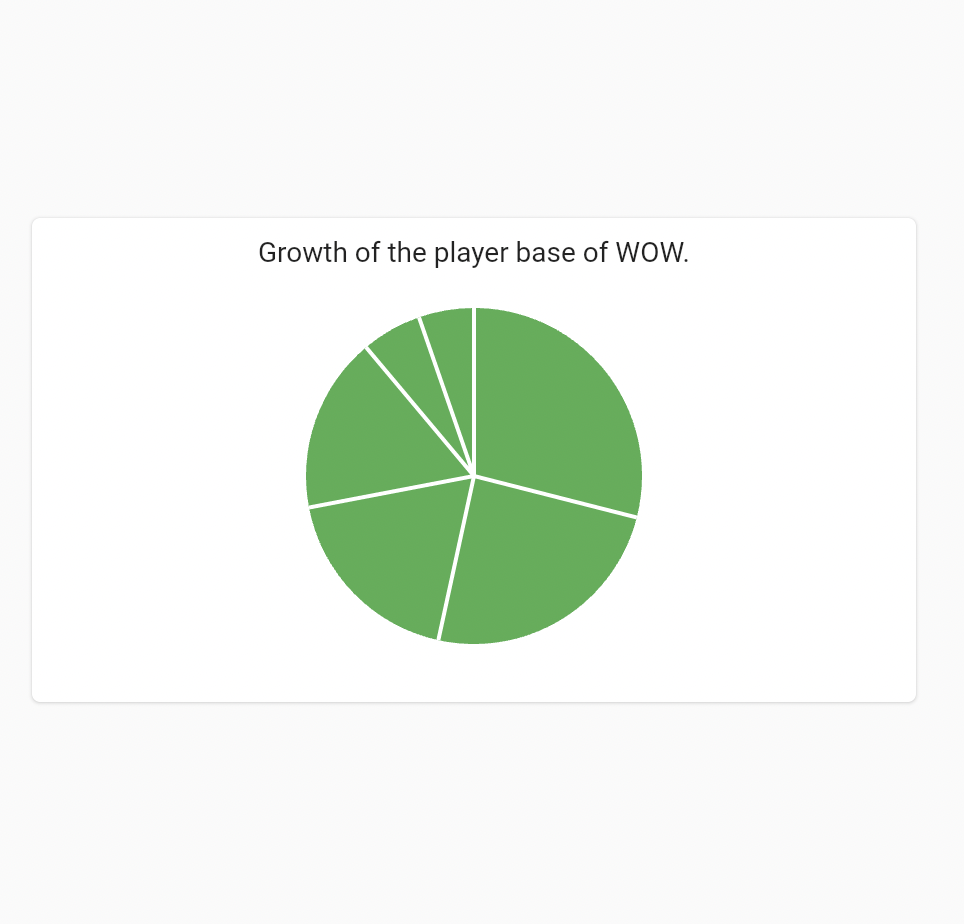
Okay, but what if you want to display your data in a pie chart?
To change the chart type, all you have to do is replace the BarChart class with PieChart in the player_chart.dart class file.
Reload and voila!
Woah, that was super easy.
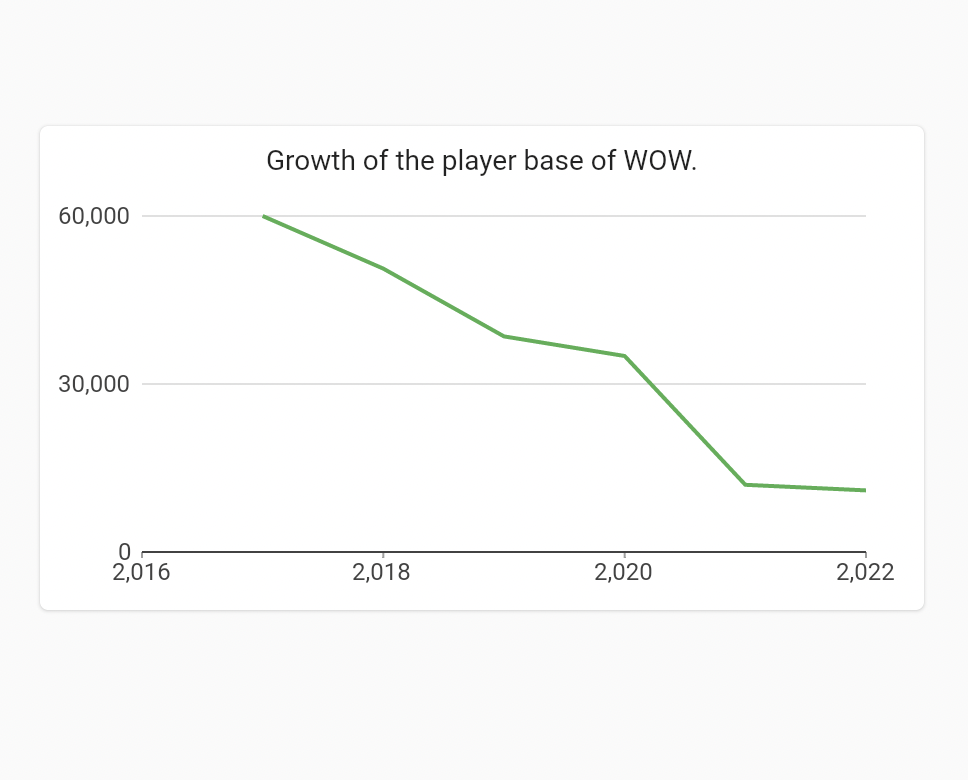
How about a line chart? For a line chart, you'll need a few more modifications.
First, change the subtype of the series object from String to num.
Then replace the pie chart with the following:
Notice that we're providing the bounds and steps for the chart to plot the data.
Reload, and there you have it.
Quite simple.
Conclusion
While searching for solutions or guidance, you might find yourself overwhelmed by the amount of information and different paths you can take. In a rush to deliver value to your clients, you might introduce bugs and security vulnerabilities that can compromise user data and platform integrity.
We recommend our behavioral replay engine at Waldo, a script-less way to quickly build a comprehensive test suite for teams who don't compromise on speed and quality. You can learn more about it here.
Automated E2E tests for your mobile app
Get true E2E testing in minutes, not months.