


Last week we looked into the pros and cons of four popular crash reporting tools. This time, we’re going to dive into the integration part.
Now, the details of integration are going to vary per combination of package and platform, and so rather than repeat their excellent documentation here, I’ll proceed using the Android example app from our previous article, combined with the Sentry open-source platform. Code snippets are all in Kotlin.
Integration code will differ if you are working with iOS or not using Sentry, but you can find analogues to all of these features across many platforms.
Out-of-the-box
Most of the stock integrations give you a lot of the information we were hoping for. Here’s what Sentry does with an Android crash with only a few lines of initialization code:
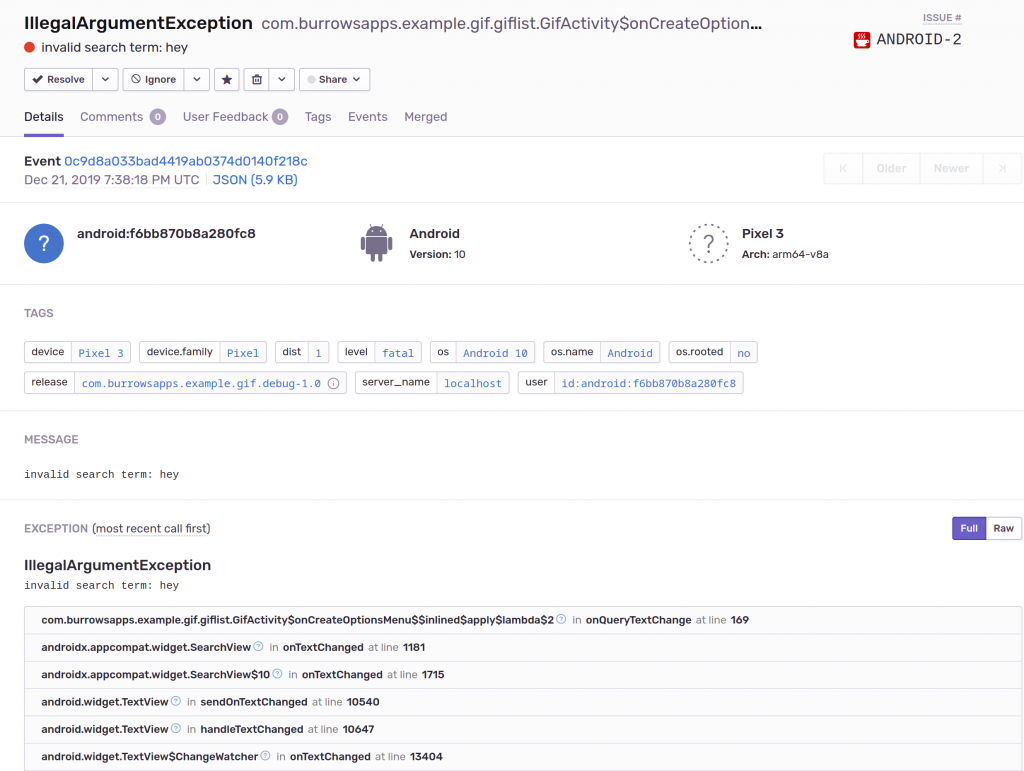
But this is only a snapshot at the moment the crash happened. We desire many more data points, such as device logs and navigation through the app. These are going to require rolling up our sleeves a bit.
Attaching logs
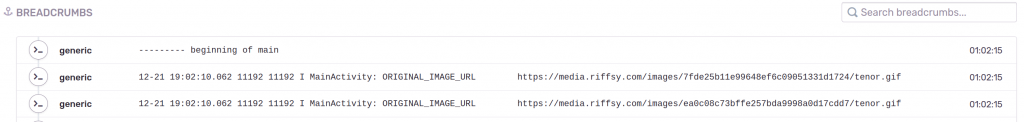
Because logs tend to be quite verbose, they aren’t by default attached to error reports. However, you may want to consider attaching a small segment of the device log to give a bit of prelude to your error.
For example, this snippet should follow your Sentry init code, and will configure Sentry to automatically attach the last 50 lines of logcat output (INFO level) as breadcrumbs:
These appear in the Sentry UI within the crash report, under “Breadcrumbs”, and are searchable:
Further customization is possible by tinkering with the BreadcrumbBuilder and logcat parameters.
Navigation
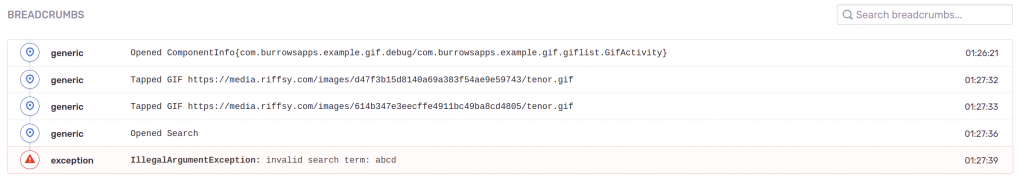
Knowing where the user has been can add valuable reproduction steps to your crashes. Sentry doesn’t automatically trace navigation, you can easily attach navigation breadcrumbs that are then included with reports.
Our example app is fairly representative in that it uses a combination of activities, dialogs, and different view states to move the user between screens. A common trick is to tap into ActivityLifecycleCallbacks for major navigation:
You may want to consider logging other parts of the activity lifecycle such as pause or destroy, especially if your app has a history of issues involving rotation, being minimized, restoring state, etc.
Next, add extra breadcrumbs within click listeners and other navigation such as showing dialogs:
After hitting a crash, navigation through the app is visible in the report, also under “Breadcrumbs”:
Non-fatal errors
Automatic error reporting generally relies on installing uncaught exception handlers that save some information about the exception before letting the app crash. However, nothing happens for exceptions that your app catches. To send handled exceptions, use:
If an error occurs that didn’t result from an exception, or if you just want to generate a report for an unexpected state, you can also use the capture overload that takes a string:
It’s tempting to take a shotgun approach and try to log everything. But this can overwhelm anybody tasked with triaging crashes when your reports are a constant stream of maybe-problems. So follow some **DOs** and **DON’Ts**:
DO log errors that are:
In this-can-never-happen error handlers, else blocks, etc. It’s hard to anticipate how code will evolve over time, or what weird states the user might force the app into, so never say never!
Rare or obscure, say involving cryptography or disk IO. At least you’ll learn how rare these errors truly are.
Degrading user experience, say if an error prevents a screen from opening when it should.
DON’T log errors that are:
Transient, such as network timeouts or session expiry.
Expected and routine, such as validation errors, or having insufficient permissions to use shared resources like the camera.
Cleanly handled, such as a failure to write to an SD card that has been ejected.
Not-actionable, such as a failure to write a file due to a full disk.
This will maintain your error logger as a valuable source of insights rather than a burden.
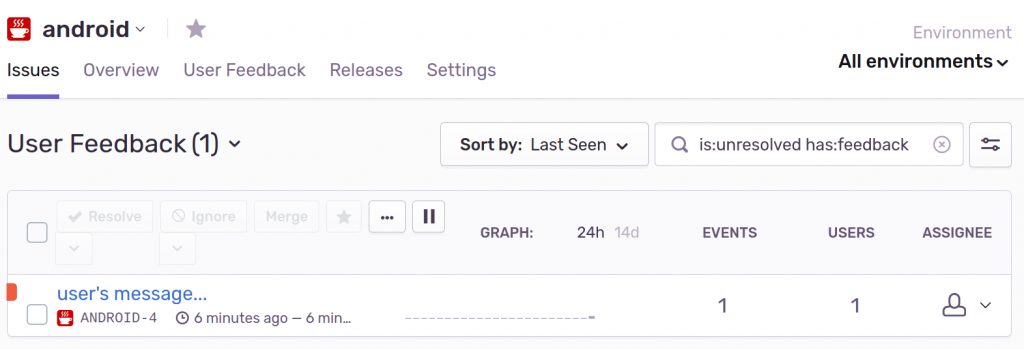
User-solicited feedback
You may want to consider including a mechanism in your app that encourages users to submit a short message when encountering trouble. You can attach all the same context as a regular error report, plus their feedback. This also provides a channel for your support team to gather data when dealing with struggling users, instead of extended Q&A via email.
Sentry doesn’t expose their native user feedback mechanism in the Android integration, but you can easily tag and submit the user’s message as a regular report:
Tags are simply arbitrary key-value pairs used to help organize reports. In the Sentry UI, you can create a Saved Search by tag “feedback” to isolate user feedback from actual errors:
Beyond the basics
There are endless variations you can experiment with using tags, breadcrumbs, context, error captures, etc. But at some point, you may want extra data that would be inappropriate to capture from a general audience, for fear of leaking sensitive details. For example, HTTP requests and responses or even individual keystrokes might be nice to have, but a liability to collect from everybody.
If your QA team is practicing exploratory testing, it might be useful to log more actions than usual, so you have adequate reproduction steps after hitting an unexpected crash.
Perhaps you’re running automatic tests on physical devices using a CI environment like Waldo. Here, you can log anything you wish without risking a leak of sensitive data.
As we’ve seen in an earlier article, it’s easy to introduce a build variant for QA and/or Waldo to use. So going forward, let’s assume the presence of a dimension called Environment, with a flavor QA.
Tagging test build reports
It’s a good practice to direct all reports from developer, QA, or CI environments into a distinct environment so that they can be filtered out from general user reports.
Sentry provides such a facility, which you can make as specific or general as you wish. We can use flavor + build type, which gives us an environment for debug builds used by devs, one for QA, and another for general release.
This way, you can separate errors hit by developers working on potentially unstable code, from QA who are working with release candidates, and from live users whose crashes are most important.
HTTP request/response
Many HTTP libraries include the capability to dump logs of the request/response cycle, and then you can read it back in the Sentry error report by dialing up the logcat level.
So first, modify the OkHttp config to enable logging for “qa” builds:
Then, tweak the logcat dump command to include debug level logs, and to mark OkHttp’s output as HTTP breadcrumbs, which will help organize them:
Automatically open reports
The Sentry client normally lays dormant on the device, silently gathering data and eventually transmitting it at a convenient time. But this process can be frustrating to anybody not feverishly refreshing the Sentry project page, waiting for bugs to appear.
One way you can help answer the question of “where did my Sentry crash go?” is by tracking reported issues on the device, and then surfacing that issue after it has been uploaded.
First, we’ll generate a unique search ID for QA crashes, and attach it to all generated issues:
Next, hook Sentry’s send callback, and for fatal errors, save search_id in a shared preference:
Finally, choose an appropriate place in the app to surface the error, and provide a link to the Sentry search page that will find the report. Substitute “host” for your own Sentry instance and “project” for the Sentry project name:
Sentry provides a mobile UI, so viewing the report on the test device itself works reasonably well. QA can then pass this link along to developers along with a description of the problem, and then the assigned dev can self-serve the crash details without having a back-and-forth about what was tried, whether the logs are available, etc.
Conclusion
Mobile app development presents unique challenges in chasing down bugs, because users are bringing one of dozens of possible iOS devices, or one of thousands of Android devices. Multiple major versions of each mobile OS are in widespread use at any given time. So collecting, aggregating and reporting on crashes by platform and version is practically a necessity.
Your crash reporting infrastructure becomes a valuable tool for internal staff: where app crashes can be triaged, and detailed QA or CI crash reports are organized for when bugs land on developers’ desks.
When combined with physical device testing, you’ve got an excellent start at reproducing fringe issues that otherwise lead to frustrated users and one-star reviews.
So now that your crash reporter is setup, why not try reproducing those tricky issues with Waldo?
Automated E2E tests for your mobile app
Get true E2E testing in minutes, not months.


