


App crashes are unavoidable, and they happen all the time. When a published app crashes on a user's iOS device, Apple sends a crash log to the developer. Because of that, the developer should know how to read and analyze the log in order to fix the bug.
In this post, we are first going to learn about app crashes. After that, we'll learn about the ways to access crash logs. Next, we'll learn to analyze the crash logs, followed by learning to symbolicate the crash report. Lastly, we'll learn about different types of exceptions.
Why Do Apps Crash?
Apps can crash for a variety of reasons. Some common reasons include:
- Watchdog issues, such as Watchdog's timeout in iOS.
- Threading issues, such as if your app blocks the main thread of iOS.
- Classic developer mistakes, like dividing something by zero.
- An error in the latest release of iOS.
- A bug in the open-source package used by the developer.
How Do You Access Crash Logs?
If the app is on App Store and crashes on a user's iOS device, then Apple will send the crash log to the developer. The developer can also get the crash logs directly from a physical device. For this to happen in a controlled environment, the developer can crash the app on their device. Sometimes for bigger bugs like Watchdog timeouts, the app will then crash on all devices.
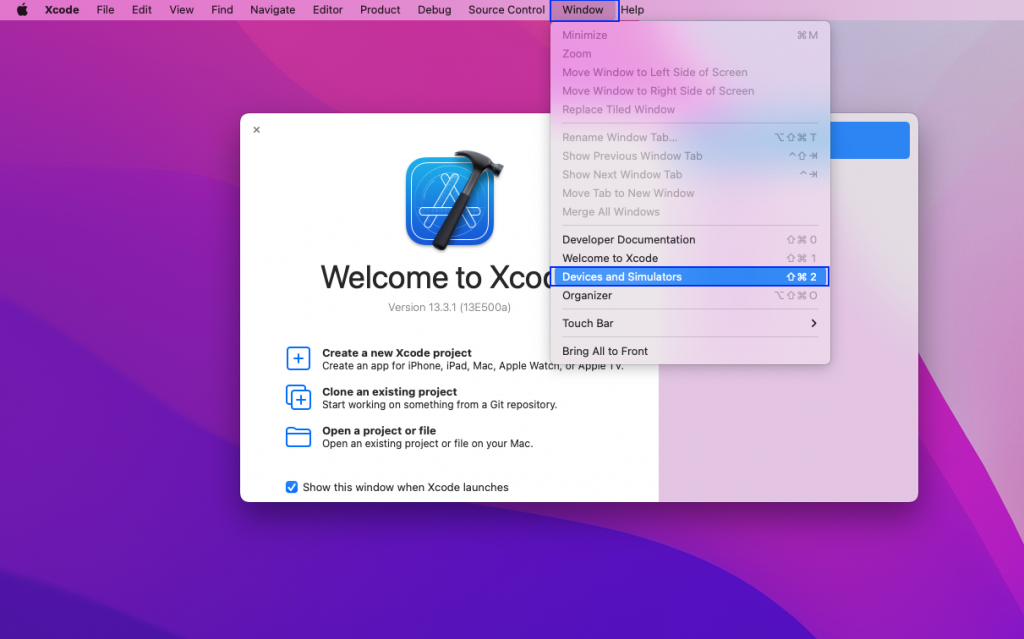
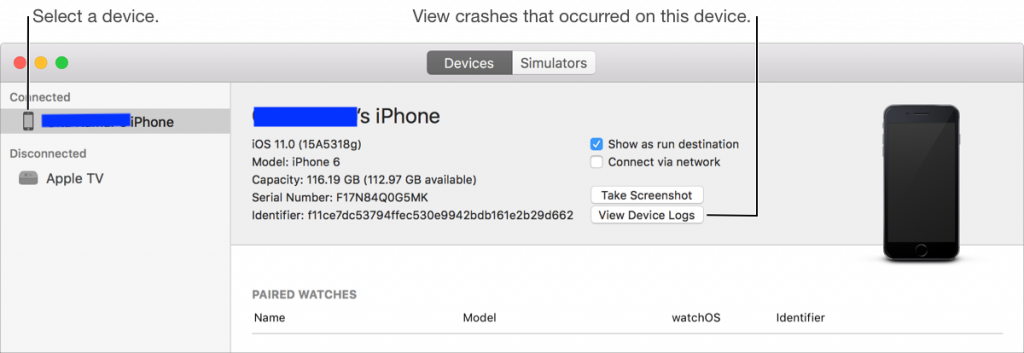
To get the log from a physical device, first connect your iPhone/iPad to a Mac machine. After that, open Xcode and then click on Window. Then click on Devices and Simulators. Now you can see all the logs.
You can also see the crash log on an iPhone/iPad by going to Settings -> Privacy -> Analytics -> Analytics Data. You can also see the crash log on a simulator if the app crashes during building through a simulator.
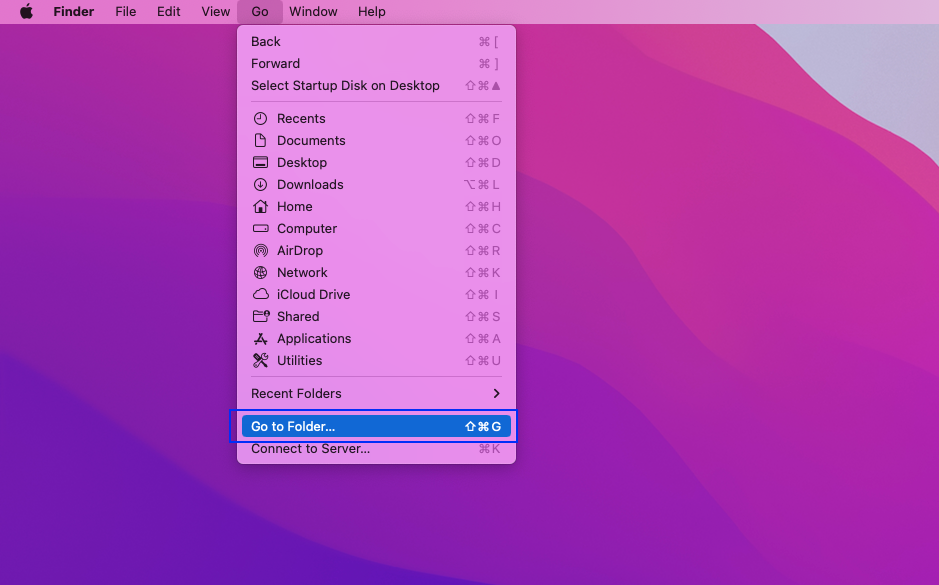
To see the simulator log, first open Finder. After that, click on Go and then click on Go to Folder...
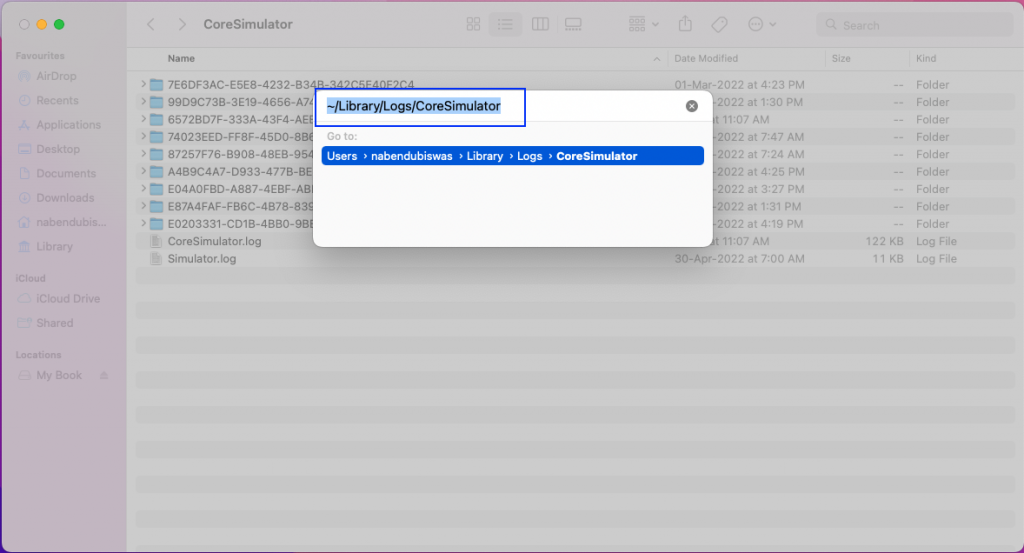
It will open a box, in which you can type ~/Library/Logs/CoreSimulator and press enter.
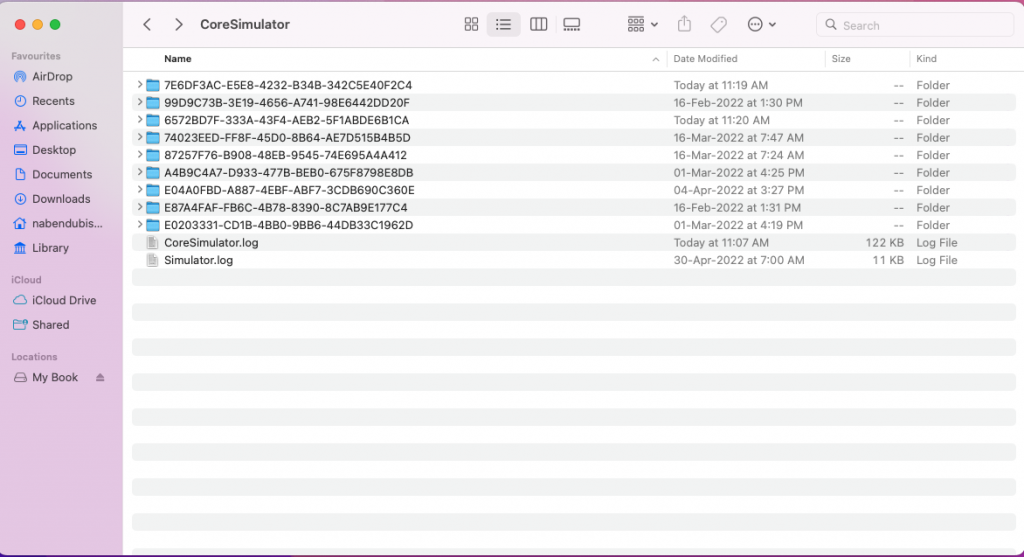
Now we can see all the logs, including the crash logs for different applications. These logs can be easily opened with any text editor.
How Do You Analyze Crash Logs?
There is a pattern in the crash log, and we can understand it easily. By doing so, we can quickly find the root cause of the error and fix it. There are three sections in a crash report, and we'll will look into them below.
Header
The header contains the process information and other information related to the crash. It looks like the example below, containing the Incident Identifier first, followed by the CrashReporter Key. Both of these are unique keys. After that, Hardware Model, Process, Path, Identifier, and Version are given. These fields are self-explanatory. Then we have the Code Type field, which is ARM, because all iPhones/iPads use ARM processors.
Next, the Date/Time of the crash is given, followed by OS Version and Report Version.
Exception Information
The next thing in the crash log is the exception information. This contains the most obvious reason for the crash. Here, the Exception Type can mean different things, and we'll look into those in detail in a later section.
Exception Backtrace
Next, we have the exact exception backtrace. This is very useful, and we can trace the exact root cause of the crash from it. It looks like the example below.
But it contains all hexadecimal addresses, and these needed to be changed to human readable addresses before we can use them. We use the process of symbolication to do that.
How Do You Symbolicate a Crash Report?
Connect you iPhone/iPad to a MacOS system and open Xcode. After that, click on Window, then click on Devices and Simulators. Now you can see all the logs. The logs which we see here are symbolicated and contains proper information.
Here, all the hexadecimal and other system-related things have been changed to a human-readable form automatically by Xcode.
If you are not able to find the crash file here, you have likely received the crash file from other sources. Suppose we got the crash file from Apple, as our app was in App Store from some user's device, and we cannot see the crash file in our device. In that case, we need to manually symbolicate the crash report. This process is well documented on the Apple site here.
Exception Types in Exception Information
Earlier, we looked at exception types, each of which contains exception information. Each exception type means a different thing, and we'll look into them below.
EXC_CRASH (SIGKILL): This one means that the process was killed by the system. The most common reason is Watchdog termination. Apple expects the app to launch quickly, but if it takes too much time to launch, the Watchdog terminates it.
EXC_CRASH (SIGQUIT): In this one, the process is terminated by the main process. Suppose the keyboard is taking a lot of time to load, then the app can request to kill the keyboard process.
EXC_CRASH (SIGABRT): This one means that the process was terminated because of an exception in the Objective-C/C++ code. It also occurs when the Objective-C/C++ code takes more time to initialize.
EXC_BREAKPOINT (SIGTRAP): This one means that the process was terminated because of an exception in the Swift code. The most common errors are a non-optional type with a nil value, or a type conversion which was forced and failed.
EXC_BAD_ACCESS (SIGSEGV): This one occurs when the app tries to access an invalid memory location. This issue generally happens in Objective-C code, which is not good with memory management. Modern iOS apps with Swift are better at memory management.
EXC_BAD_INSTRUCTION (SIGILL): The one occurs when a process in the app tries to run some illegal statement that's not allowed in iOS.
Conclusion
In this post, we've learned to read iOS crash logs. We first learned about app crashes in iOS devices, then we learned about the different methods to access the crash logs. After that, we learned to analyze the crash logs and about the different parts in a crash log.
Next, we learned to symbolicate the crash report. Lastly, we learned about the different exception types in the exception information.
You should now be able to take this information and use it to find and fix issues in your own iOS apps. This should help you more easily develop and maintain iOS apps.
If you want to learn more about automated end to end testing of your iOS app, visit Waldo.
Automated E2E tests for your mobile app
Get true E2E testing in minutes, not months.


